Driving the Road Less (and Most) Traveled from DC to NYC

Driving the Road Less (and Most) Traveled from DC to NYC
Last month, I started planning a long weekend trip from my hometown of Richmond, VA to New York City. One of the first questions that came to mind was what form of transportation I should take. I knew if I took a bus or car, I’d be certain to hit plenty of traffic to NYC on the way.
As a StreetLight employee, this got me thinking about how many drivers must travel between two of the busiest cities on the east coast, DC and NYC. For my driving trip, I assumed that most drivers would take I-95, but I wanted to avoid that traffic to NYC as much as possible.
I wondered how many other drivers also wanted to avoid I-95, and what alternate routes they were choosing to NYC. Luckily, with StreetLight’s new Top Routes analysis, I was able to find out in just 20 minutes and two steps. And it turned out my assumptions were wrong.
Hitting the Road with StreetLight InSight®
Running the analysis was easy. First, I uploaded shapefiles for DC and NYC.
Then, I ran a “Top Routes Between Origins and Destinations” analysis, set to the default options for day types, day parts, etc. — except I only ran data from October 2016, 2017, and 2018, because I wanted to exclude seasonal variation and focus on the time of year I would be traveling.
Figure 1: Traffic leaving DC for NYC flows primarily via I-95.
DC’s Top Traffic Routes to NYC
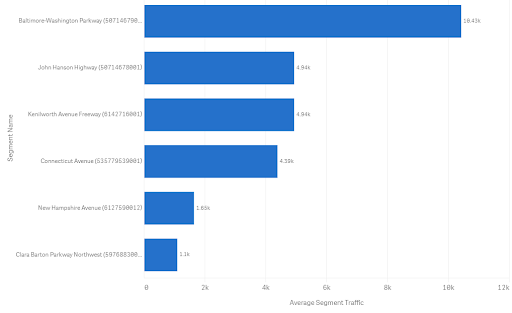
The analysis revealed that DC drivers leave through five main corridors:
- The Baltimore-Washington Parkway
- The John Hanson Highway
- The Kenilworth Avenue Freeway
- Connecticut Avenue
- New Hampshire Avenue
- Clara Barton Parkway Northwest
Figure 2: Drivers leaving DC primarily choose the Baltimore-Washington Parkway.
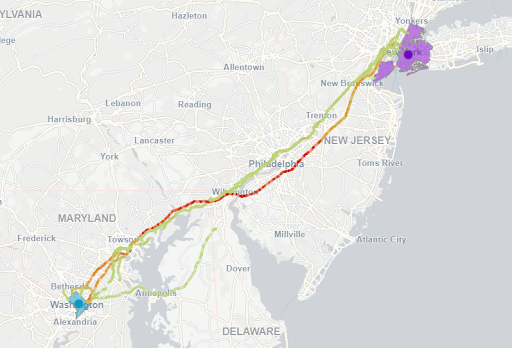
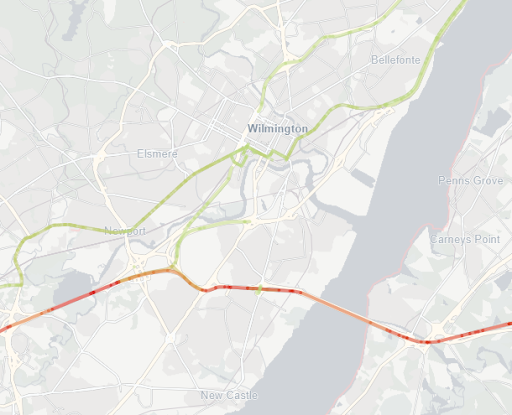
Most drivers take I-95 out of DC, as I anticipated. But I was surprised to see that the majority then shift quickly to the New Jersey Turnpike. Just take a look at where the Turnpike splits off from I-95, near Wilmington, Delaware, below. It turns out most people think like I do, and avoid I-95 to NYC. Maybe they’re even stopping at the best rest stop along I-95 just 15 minutes away.
Figure 3: Heat mapping shows that south of Wilmington, most DC-to-NYC drivers shift from I-95 (green) to the New Jersey Turnpike (red/orange).
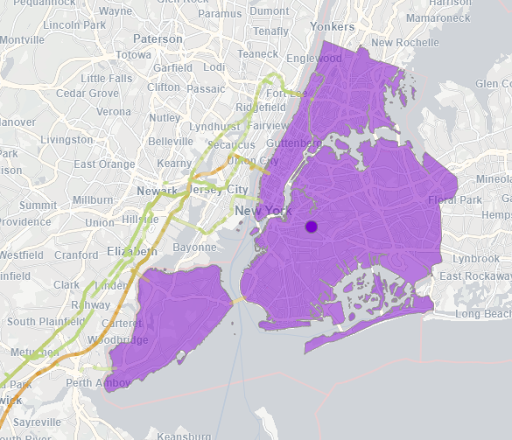
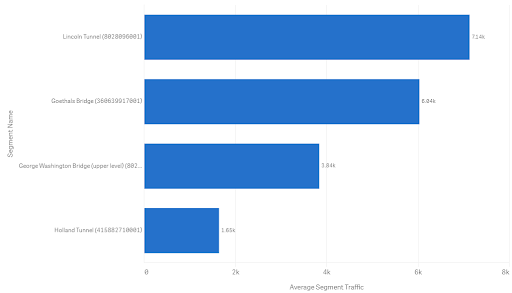
Once traffic gets to NYC, more drivers combined take bridges than tunnels. Despite that, the top route is the Lincoln Tunnel.
Figure 4: DC routes into NYC heat-mapped by traffic volume.
Figure 5: Most traffic to NYC from DC enters via the Lincoln Tunnel.
How the Rest of the US Enters NYC
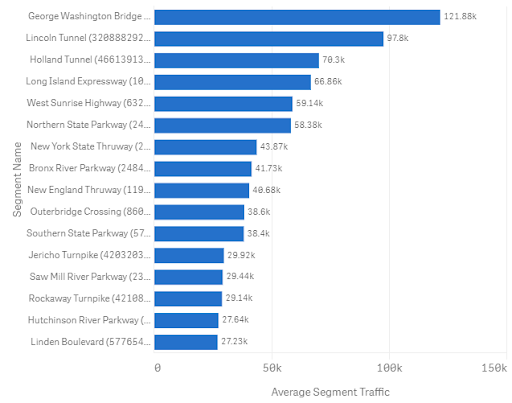
Studying DC’s traffic to NYC made me curious about the routes drivers take from everywhere else in the U.S. After a quick “Top Routes for Zones” analysis, I found out that the most popular national routes for traffic to NYC are slightly different than the routes for DC drivers. They are, in this order:
- George Washington Bridge
- Lincoln Tunnel
- Holland Tunnel
- Long Island Expressway
Figure 6: Heat map of national traffic into NYC.
Figure 7: Drivers to NYC from the rest of the US prefer the George Washington Bridge.
Having access to information like this across a region is a great input into project prioritization and budget allocation.
Top Takeaways from Top Routes
This was just a cursory analysis to understand what I can expect from traffic to NYC on my drive — and I’ll definitely be taking I-95 instead of the New Jersey Turnpike.
But digging into this data on a more granular level could lead to macro and micro implications for these two cities (and any other large neighboring cities).
Further analysis can show, for example:
- Do these patterns change on the weekends, or over the summer?
- If one of these roads needs maintenance, how will a detour impact the adjacent roads?
- How will Amtrak’s new high-speed Acela Nonstop train impact these travel patterns?
- Will next year’s election have an impact on this traffic?
The questions are endless, but with StreetLight InSight, the answers are right at our fingertips.
The Best I 95 Rest Stops (According to Big Data)
The Best I 95 Rest Stops (According to Big Data)
Now that we’re in the full swing of summer here on the East Coast, my friends and family have been taking road trips along I-95 – and for better or for worse, rest stops are an inevitable part of those trips. A few weekends ago, my parents’ car broke down on their way back home from New York, but fortunately they were able to make it to a rest stop. As my mom texted me from the rest stop parking lot, waiting for a tow truck at 11pm, I started to wonder: How many other people were at rest stops at such a late hour? Who else might be there with my parents? Was this rest stop typically a busy one?
It wasn’t long before I realized that, as a StreetLight Data employee, I had the answers at my fingertips – it was just a matter of running a study with StreetLight InSight®, our on-demand transportation analytics platform. In this post, I’ll show you what I found out, and share a few tips for evaluating your state’s rest stops.
The StreetLight InSight Analysis
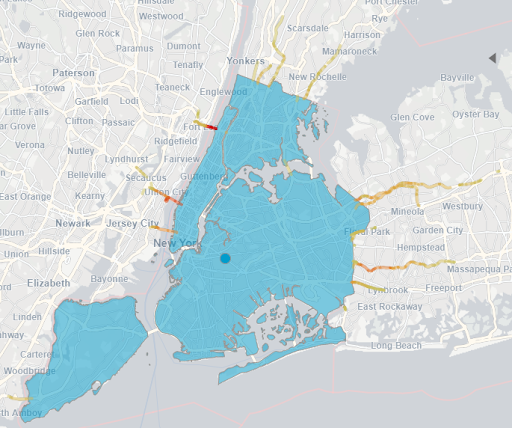
I used StreetLight InSight to analyze the volume of traffic entering and exiting 76 rest stops along I-95 – an interstate highway that runs down the East Coast of the U.S. from Maine to Florida – during the months of June, July, and August in 2017.
To do this, I first downloaded a list of 103 rest stops by latitude/longitude from POI Factory. From there, I removed any rest stops that did not have any facilities – basically, rest stops that just have parking or a scenic view. Next, I entered each latitude/longitude into StreetLight InSight, located the rest stop, and drew a polygon around it to create my analysis zones.
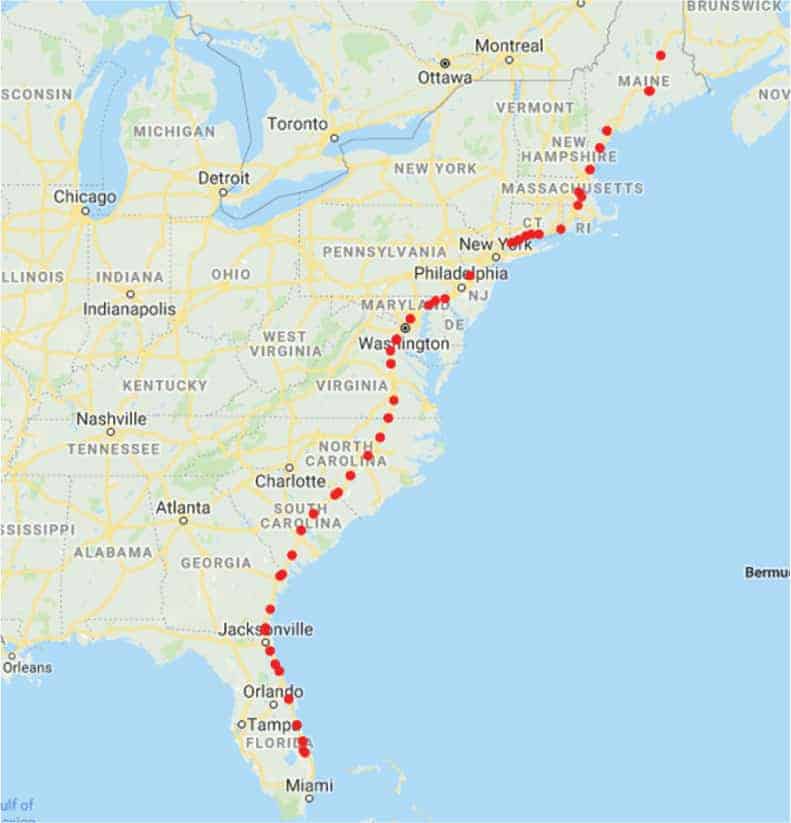
Figure 1. The map above shows all 76 rest stop locations that I included in this analysis.
I chose to analyze June, July, and August in order to capture family trips taken when kids are out of school. To run this study, I used StreetLight’s Location-Based Services data source. These are anonymous location records created by smartphone applications that provide Location-Based Services. This type of Big Data is great for analyzing personal travel, so it was the right data source to use given my focus on summer road trips. Here’s exactly what I wanted to find out:
- What are the top busiest five busiest rest stops along I-95?
- What is the busiest time of day to go to rest stops?
- Which rest stops have visitors traveling the furthest away?
What Are the Top Five Busiest Rest Stops Along I-95?
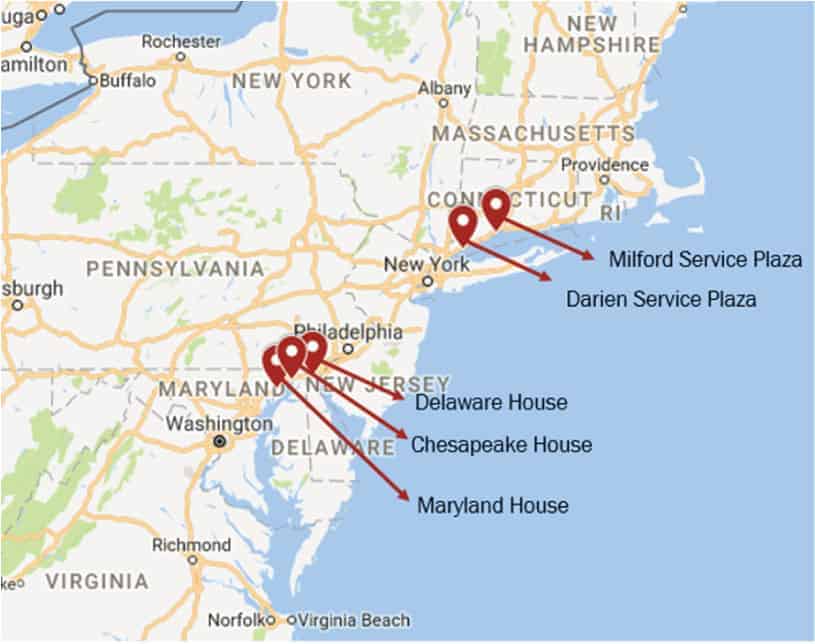
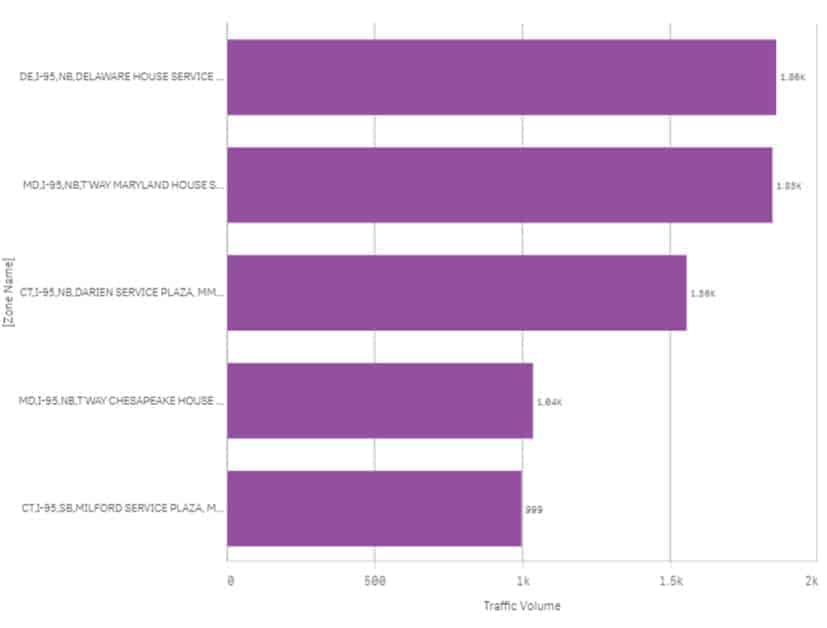
I used the StreetLight InSight Zone Activity analysis for this study. It provides transportation analytics that describe the relative volume of trips that begin, end, or pass through specific locations. The results showed that the top five busiest rest stops along I-95 are at the following locations:
- Delaware – NB/SB at MM 5 (Delaware House)* – Newark, DE
- Maryland – NB/SB at MM 81 (Maryland House)* – Aberdeen, MD
- Connecticut – NB at MM 12.4 (Darien Service Plaza) – Darien, CT
- Maryland – NB/SB at MM 2/3 (Chesapeake House)* – North East, MD
- Connecticut – SB at MM 41.4 (Milford Service Plaza) – Milford, CT
*These rest stops are in the middle of the highway, so visitors from both directions share the facility, which may help explain the high volume. But it’s a good insight for rest stop builders of the future who want to maximize visitors.
Figure 2. Locations of I-95’s top five busiest rest stops.
Figure 3. This is a visualization from StreetLight InSight of traffic volume at the top five rest stops on an average day, across the entire day, using trips that began at the rest stop. (Note: Volumes are index values, not traffic counts.)
And with that, my first question was answered – my parents were at the fourth busiest rest stop along I-95, the Chesapeake House rest stop.
It’s interesting to note that the top five rest stops are clustered around two locations. The Milford Service Plaza and Darien Service Plaza are both located north of New York in Connecticut. It is possible that these are popular rest stops because they serve travelers between New York City and Boston heading to summer beach destinations. Likewise, the three rest stops further south, in Delaware and Maryland, are between Philadelphia and Washington, D.C., and they’re “on the way” to beach destinations in the mid-Atlantic.
While I didn’t analyze rest stop amenities comprehensively as part of this study, I was curious about the services offered at the top five most popular rest stops. This is what I learned:
- They all appear to be recently remodeled.
- They all provide electric vehicle charging stations as well as gas stations.
- They each have at least six different food service options.
- Four out of the top five rest stops have green/eco-friendly initiatives: The two rest stops in Maryland are LEED certified and the two in Connecticut are solar-powered.
What Are the Busiest Times of Day to Go to Rest Stops?
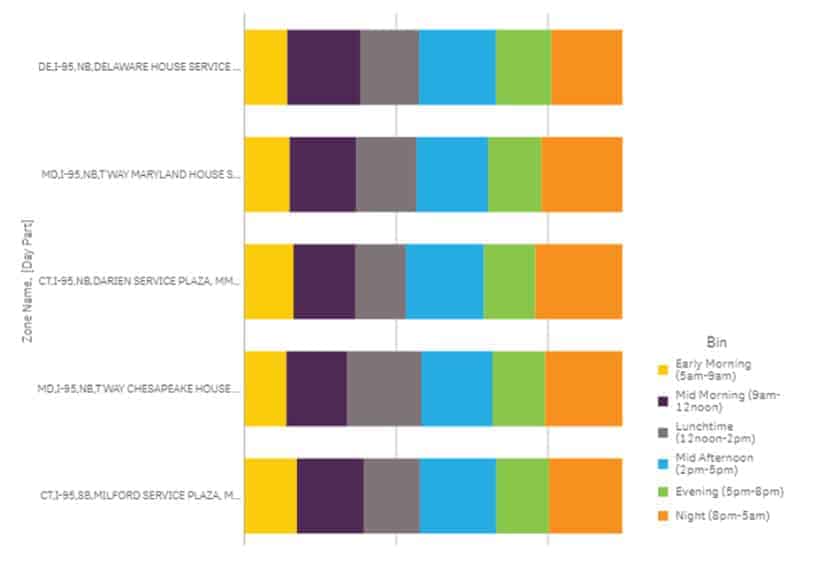
Next, I dug a little further into the transportation analytics and found out the busiest times of day to go to the top five rest stops. StreetLight InSight lets me customize day parts, so I defined them as:
- Early morning (5am-9am)
- Mid morning (9am-12pm)
- Lunchtime (12pm-2pm)
- Mid afternoon (2pm-5pm)
- Evening (5pm-8pm)
- Night (8pm-5am)
Across the top five rest stops, the busiest times of day were:
- Mid afternoon (2pm-5pm)
- Night (8pm-5am)
- Mid morning (9am-12pm)
- Lunchtime (12pm-2pm)
- Evening (5pm-8pm)
- Early morning (5am-9am)
Here’s the breakdown for each rest stop:
Figure 4. This visualization from StreetLight InSight shows the distribution of traffic volume at the top five most popular rest stops across different day parts.
With this information, I learned the answer to my second question – my parents were at the Chesapeake House rest stop during one of their top two busiest times of day, between 8pm and 5am.
Which Rest Stops Are Visitors Traveling the Furthest To?
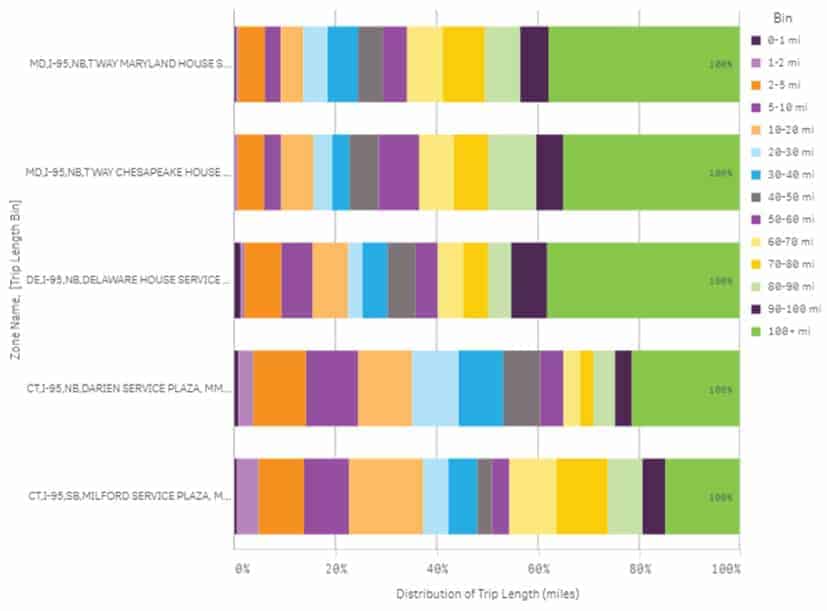
Finally, I wanted to find out which of these rest stops have visitors traveling from the furthest away. With a few clicks of my mouse, I learned that the Delaware House rest stop has visitors traveling from the furthest distance, with Maryland House in Aberdeen coming in a close second. I suspect that the popularity of Delaware House is related to this rest stop’s proximity to three highly populated metropolitan areas – Washington, DC, Philadelphia, PA, and New York City. If any local planners are reading this and have some context to share on this location, I’d love to hear from you.
Figure 5. This chart from StreetLight InSight shows the distribution of trip length at each of the top five busiest rest stops. I analyzed the length of trips that began at the rest stop.
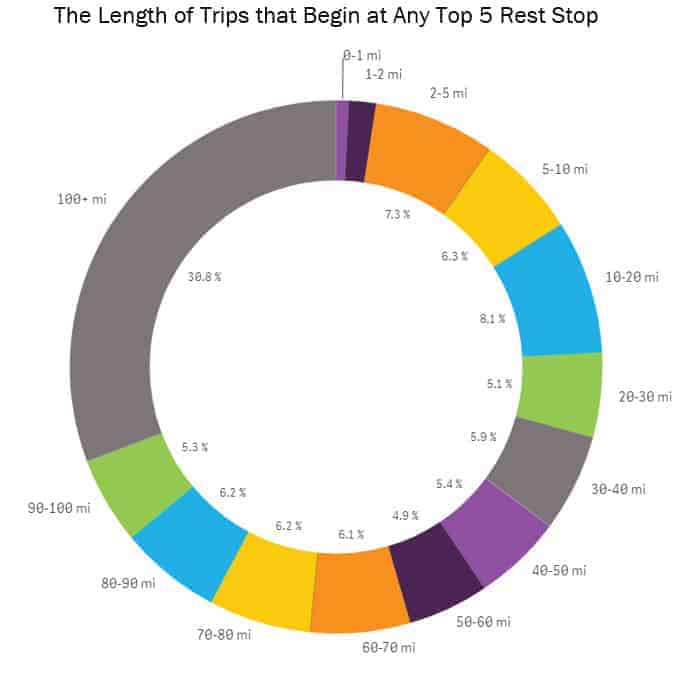
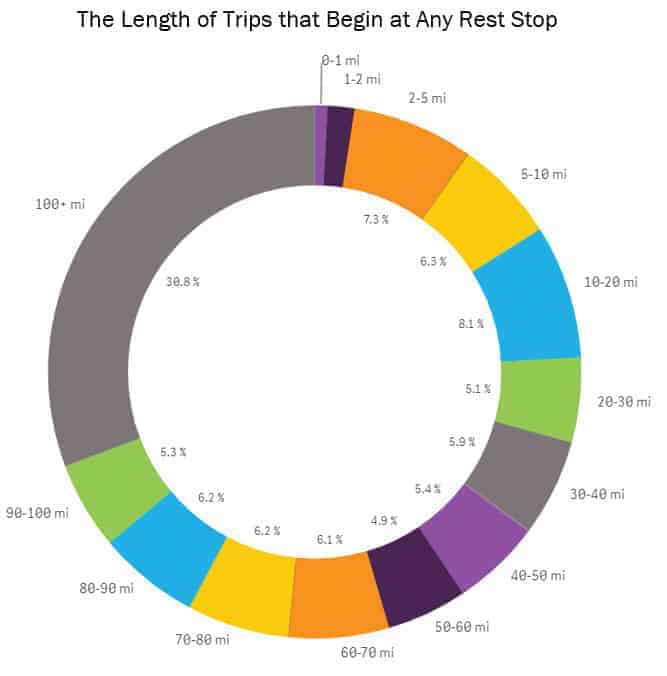
Figure 6. This chart aggregates the lengths of trips, in miles, that begin at any one of the top five most popular rest stops on I-95. More than 30% of trips are over 100 miles long. About 31% of trips are less than 20 miles long. 0.8% of all trips are less than one mile long and 1.6% of trips are between one and two miles.
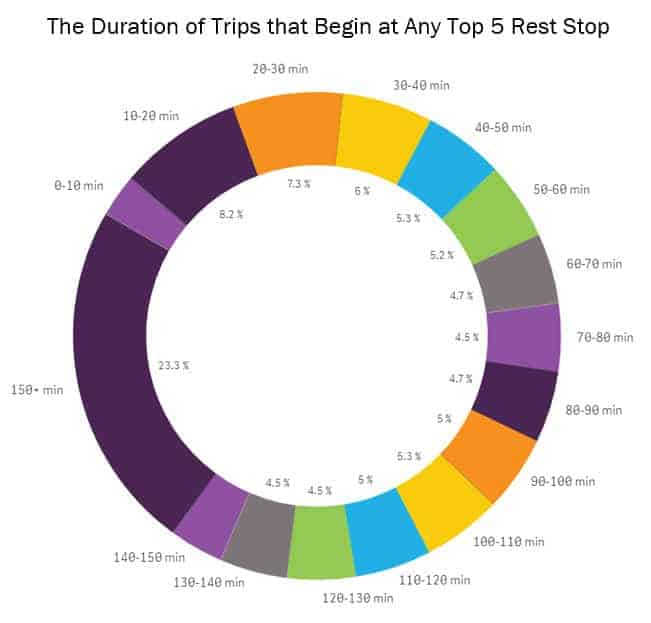
Figure 7. This chart aggregates the duration of trips, in minutes, that begin at any of the top five most popular rest stops on I-95. About 23% of these trips are longer than 150 minutes long. About 18% of trips are less than 30 minutes. 2.9% of trips are between 0 and 10 minutes.
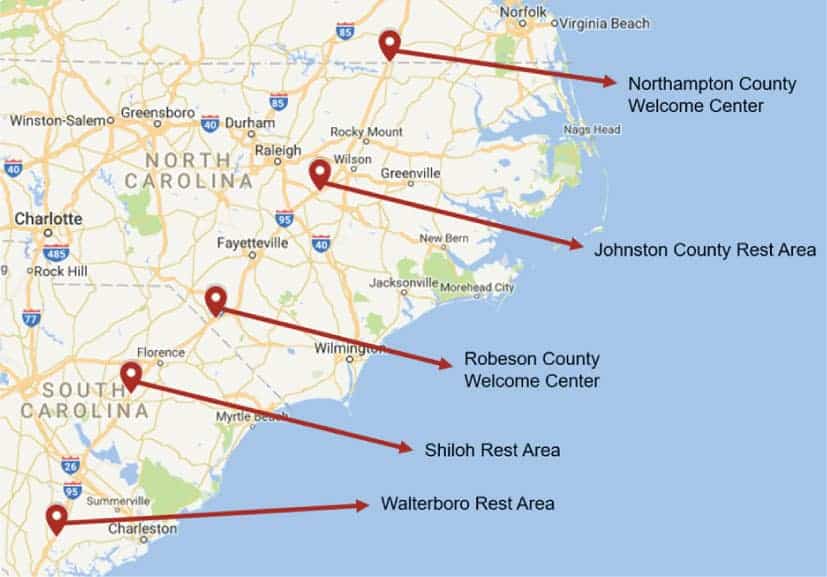
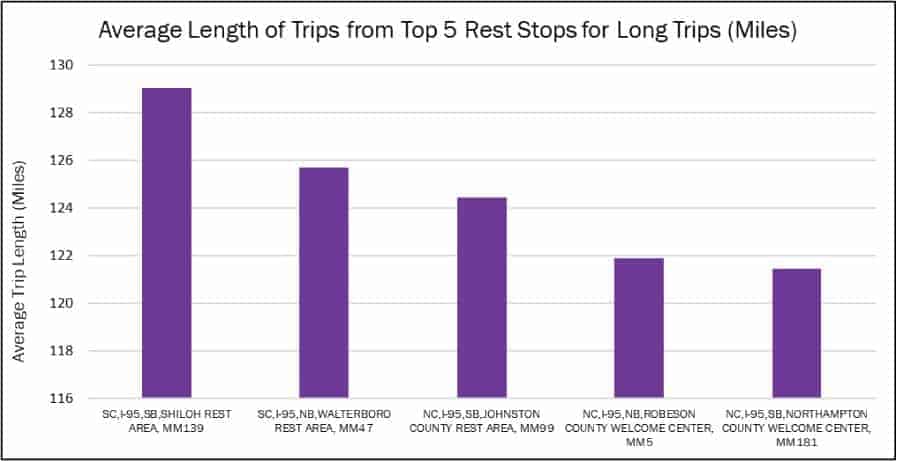
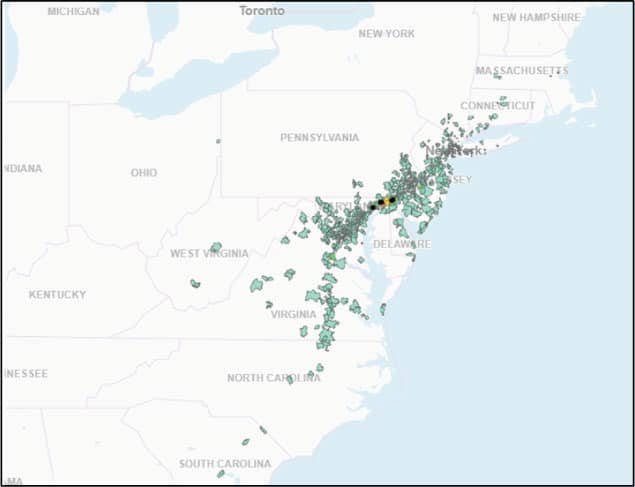
Next, I decided to look into the length and duration of trips from all of the rest stops I studied, on average. Were trips from the top five most popular rest stops typically longer or shorter than the average rest stop trip? It only took minutes to find out that the rest stops with visitors coming from the furthest distances were in South Carolina and North Carolina – states home to popular beaches like Myrtle Beach, Nags Head, and Hilton Head. Looks like people will go the distance to visit beaches in the South.
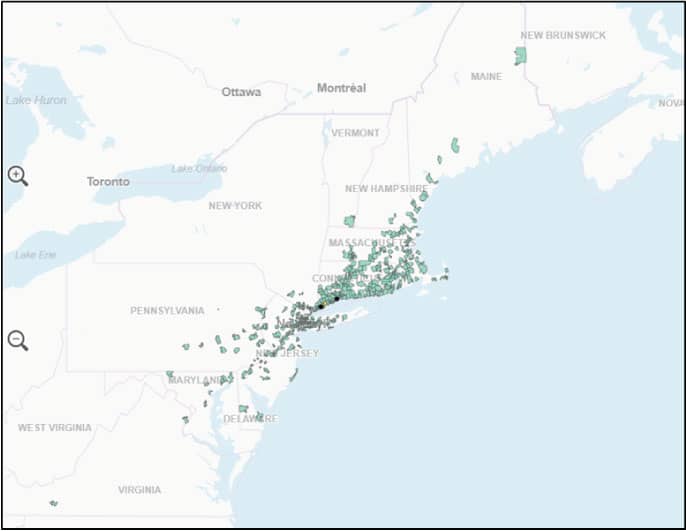
Figure 8. This map shows the rest stops that have visitors traveling the furthest distances.
Figure 9. This chart shows the rest stops that have visitors traveling the furthest distances.
Figure 10. This chart aggregates the length of trips, in miles, that begin at rest stops on I-95. I was surprised by the relatively high volume of trips under 20 miles – nearly 35%. 1.9% of trips are less than one mile and 2.7% of trips are between one and two miles.
The next step was to compare the length of trips that begin at any of the 76 rest stops I analyzed with the top five most popular rest stops. I was surprised to see the relatively high volume of shorter, regional trips that originate at rest stops. Nearly 35% of trips from all of the rest stops in the analysis are less than twenty miles long. Thirty one percent of trips from the top five most popular rest stops are under 20 miles – a slightly smaller share, but not by much.
This finding indicates that rest stops are providing important benefits and services to regional travelers – not just long-distance ones. When we invest in rest stops, we’re certainly helping road trippers and truck drivers, but also residents of local and nearby jurisdictions.
Where Do Rest Stop Visitors Go Next?
Of course, this led me to wonder: where were the visitors to the top five busiest rest stops going next, and where are their home locations? To find out, I ran two additional analyses – an Origin-Destination to Pre-Set Geography and a Visitor Home-Work analysis. Origin-Destination to Pre-set Geography analyses scan all trips that begin, end, or pass through any geography to identify the origins and destinations, ZIP code, census block group, or transportation analysis zone. (For Canadian analyses, dissemination areas are available.) Visitor Home-Work analyses provide the aggregate expected home and work locations of visitors to a specific location.
From the O-D to Pre-Set Geography analysis, I learned that the next stop for visitors traveling to the top five rest stops were generally clustered around the coast or around major metropolitan areas. Travelers departing from rest stops in Connecticut tended to go to New England’s beaches, while travelers departing from rest stops in Maryland and Delaware had a broader range of coastal destinations across the Chesapeake Bay and in New Jersey, Delaware, Maryland, and New York.
Figure 11. This heat map from StreetLight InSight show the next destinations of visitors visiting the Darien Service Plaza and Milford Service Plaza, which are both in the top 5 most popular I-95 rest stops.
Figure 12. This heat map from StreetLight InSight show the next destinations of visitors visiting the Maryland House, Chesapeake House, and Delaware House, which are all in the top 5 most popular I-95 rest stops.
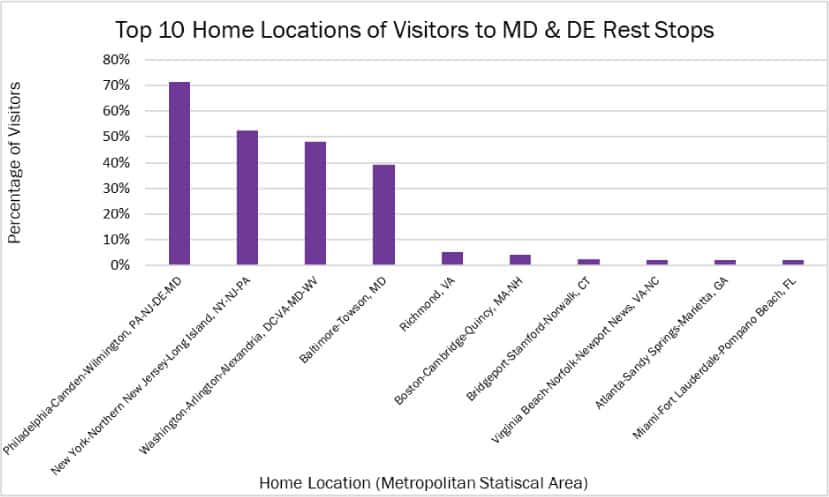
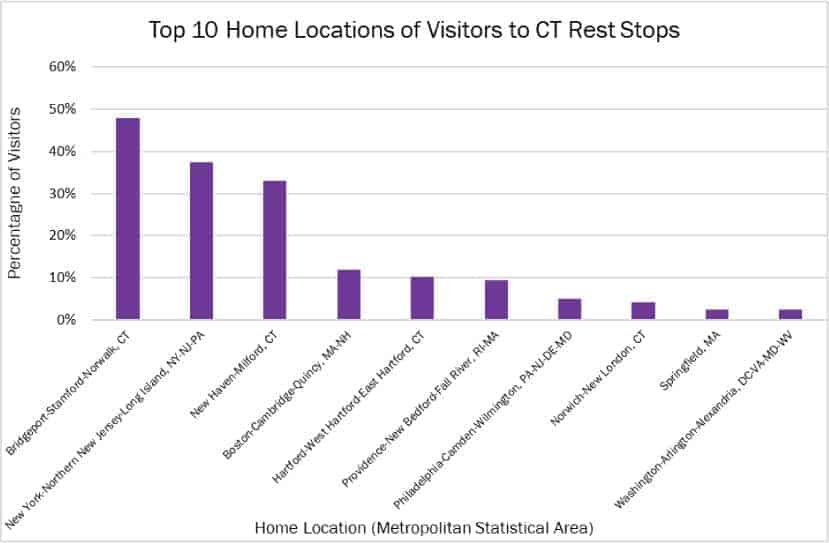
From the Visitor Home-Work analysis, I learned that visitors to these rest stops reside fairly close-by – check out the charts below. This makes sense given that over 30% of trips from the top five rest stops are fewer than 20 miles long. Plus, families traveling with children tend to stop more frequently for bathroom breaks. I’m not at all surprised that Richmond, Virginia is also a popular home destination of visitors, seeing as my parents live there, and it’s home to StreetLight’s East Coast offices!
Figure 13. This chart shows the top 10 home locations of visitors to the Maryland and Delaware rest stops that are in the top five most popular I-95 rest stops.
Figure 14. This chart shows the home locations of visitors to the Connecticut rest stops from the top five rest stops. Home locations are provided as metropolitan statistical areas (MSAs).
Conclusion
Whether you’re planning a road trip and want to avoid the crowds, a transportation planner looking to understand travel behavior for road maintenance and construction projects, or an economic development professional interested in the impact of rest stops, StreetLight InSight can provide a wealth of information in a matter of minutes.
Have you stopped at any of these rest stops – do they feel as busy as the numbers say they are? Let us know in the comments below!