Investigating how trucks impact social equity with new freight data
Investigating how trucks impact social equity with new freight data
How doestruck activity impact disadvantaged communitiescompared to their non-disadvantaged neighbors?StreetLight uses new truck data to show how you can investigate inequitable truck impacts in your community.
Truck activity can have a huge impact on local emissions and traffic congestion, but not all communities are equally affected. Now, new truck data from StreetLight helps analysts investigate how truck traffic impacts disadvantaged communities (DACs)across the U.S., and how factors like urban density, vehicle weight class, and industry type contribute – and help diagnose – inequitable impact.
Key Takeaways
In New York state, StreetLight’s data indicatesdisadvantaged communities are impacted by worse truck travel delays than non-disadvantaged communities,potentially exacerbatingnegative outcomes, such as air pollution and emissions.
Communities in the urban coreare the most impacted by truck travel delays and the added emissions and pollution they often generate.
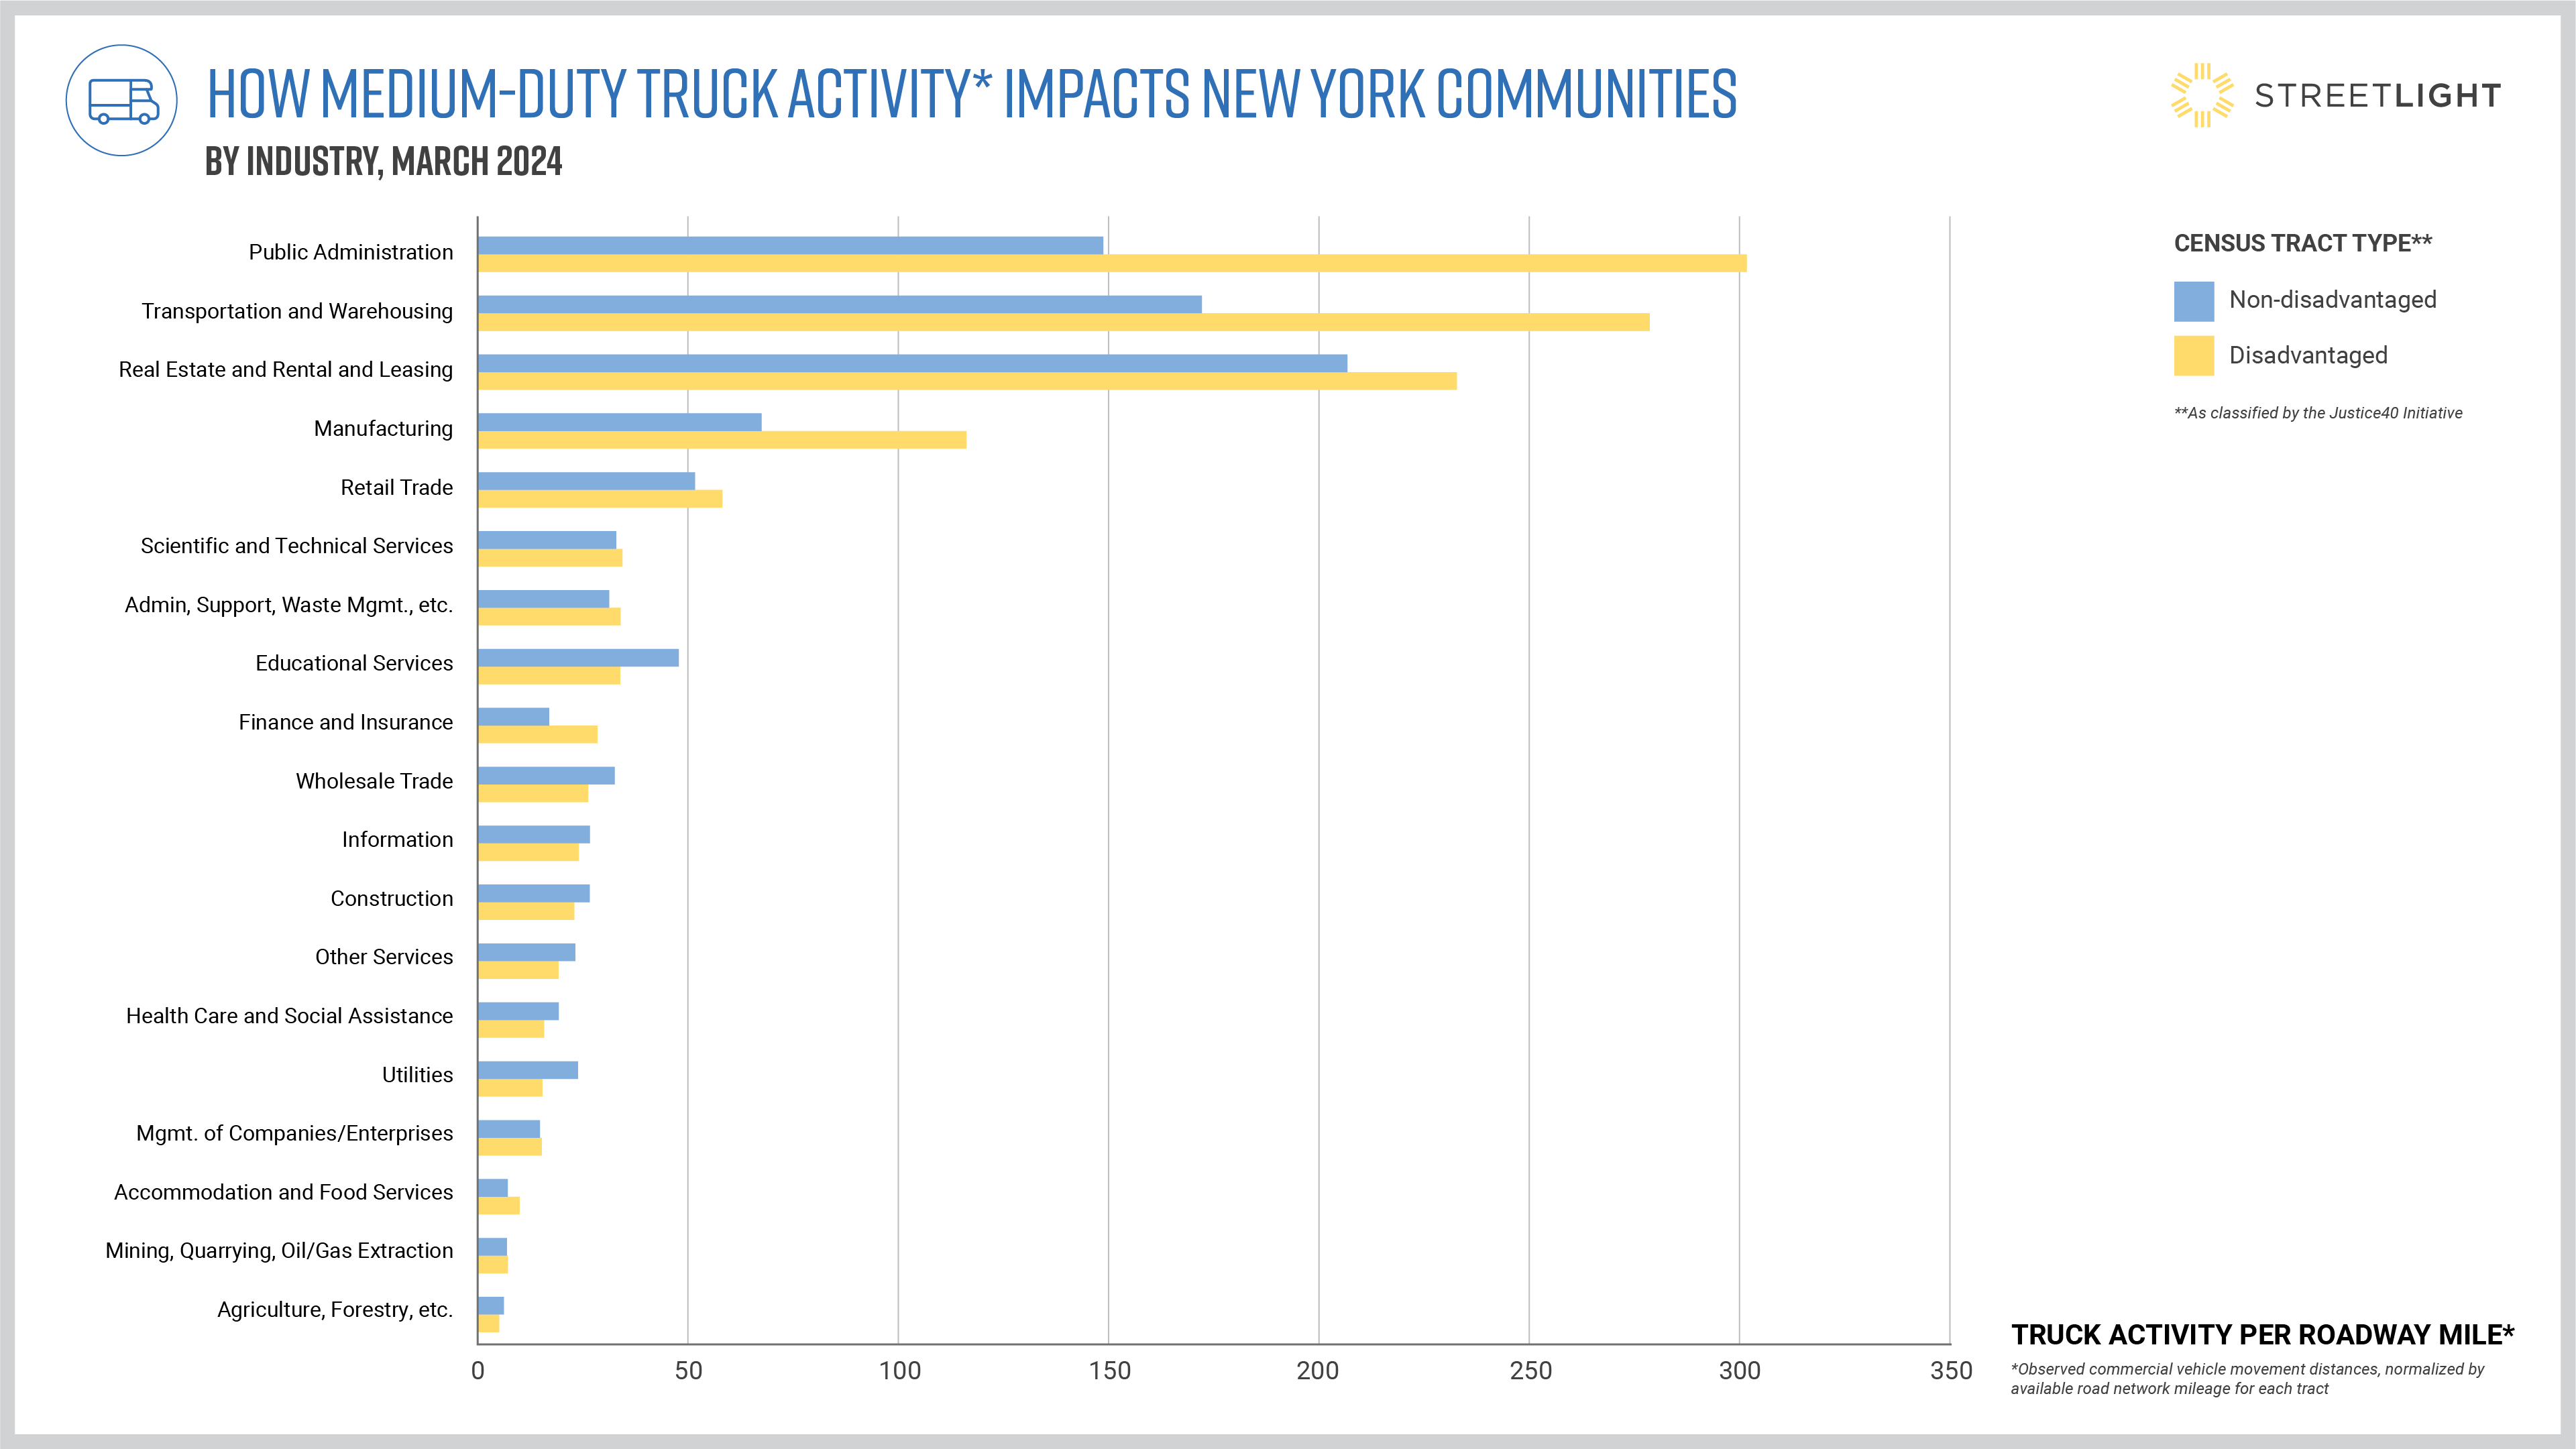
Overall, medium-duty trucks show the most unequal impact on disadvantaged communities. Trucks in this category from the public administration and transportation and warehousing industries may warrant special attention for DACs.
Trucks are some of the worst offenders when it comes to vehicle emissions. Although they are indispensable to today’s freight logistics, they also emit more CO2 and other air pollutants than cars because they typically emit more GHGs per mile in addition to traveling much longer average distances.
Compounding trucks’ oversized climate impact is a dramatic spike in freight activity. A 2021 analysis by USDOT’s Bureau of Transportation Statistics predicted total U.S. freight activity would grow 50% by 2050, with trucks accounting for 65% of that total.1 This proliferation of truck traffic also challenges existing road capacity in many communities, exacerbating rising congestion and safety issues.
And these ramifications often come down hardest on disadvantaged communities — people who live in low-income neighborhoods where high congestion, noise pollution, and poor air quality are common. For this reason, analyzing how truck activity impacts disadvantaged communities is critical to reducing harms.
Now, freight planners, fleet operators, and businesses can use new truck data from StreetLight to understand how freight activity impacts different communities, as well as investigate related questions about who truck activity serves, which industries are most represented, and how travel delays impact logistics, emissions, and equity.
Below, StreetLight analyzes commercial vehicle activity in New York, comparing its impact on DACs vs. non-disadvantaged communities.
How Trucks Impact Disadvantaged Communities in New York
Since 2021, disadvantaged communities (DACs) have been a key focus of efforts to improve transportation equity. These communities are “marginalized by underinvestment and overburdened by pollution,” as defined by Executive Order 14096, which established the Justice40 Initiative, a policy promising to funnel at least 40% of federal investments in clean energy, clean transit, sustainable housing, and similar programs into low-income census tracts that qualify as disadvantaged communities.2
In the state of New York, about 36% of all census tracts — accounting for about 35% of the state population — are considered to be DACs.
While all truck traffic can negatively impact a community’s air quality, traffic congestion, and local emissions levels, analyzing how different weight classes impact DACs vs. non-DACs can add helpful nuance to planning efforts aimed at mitigating this impact and targeting policy interventions.
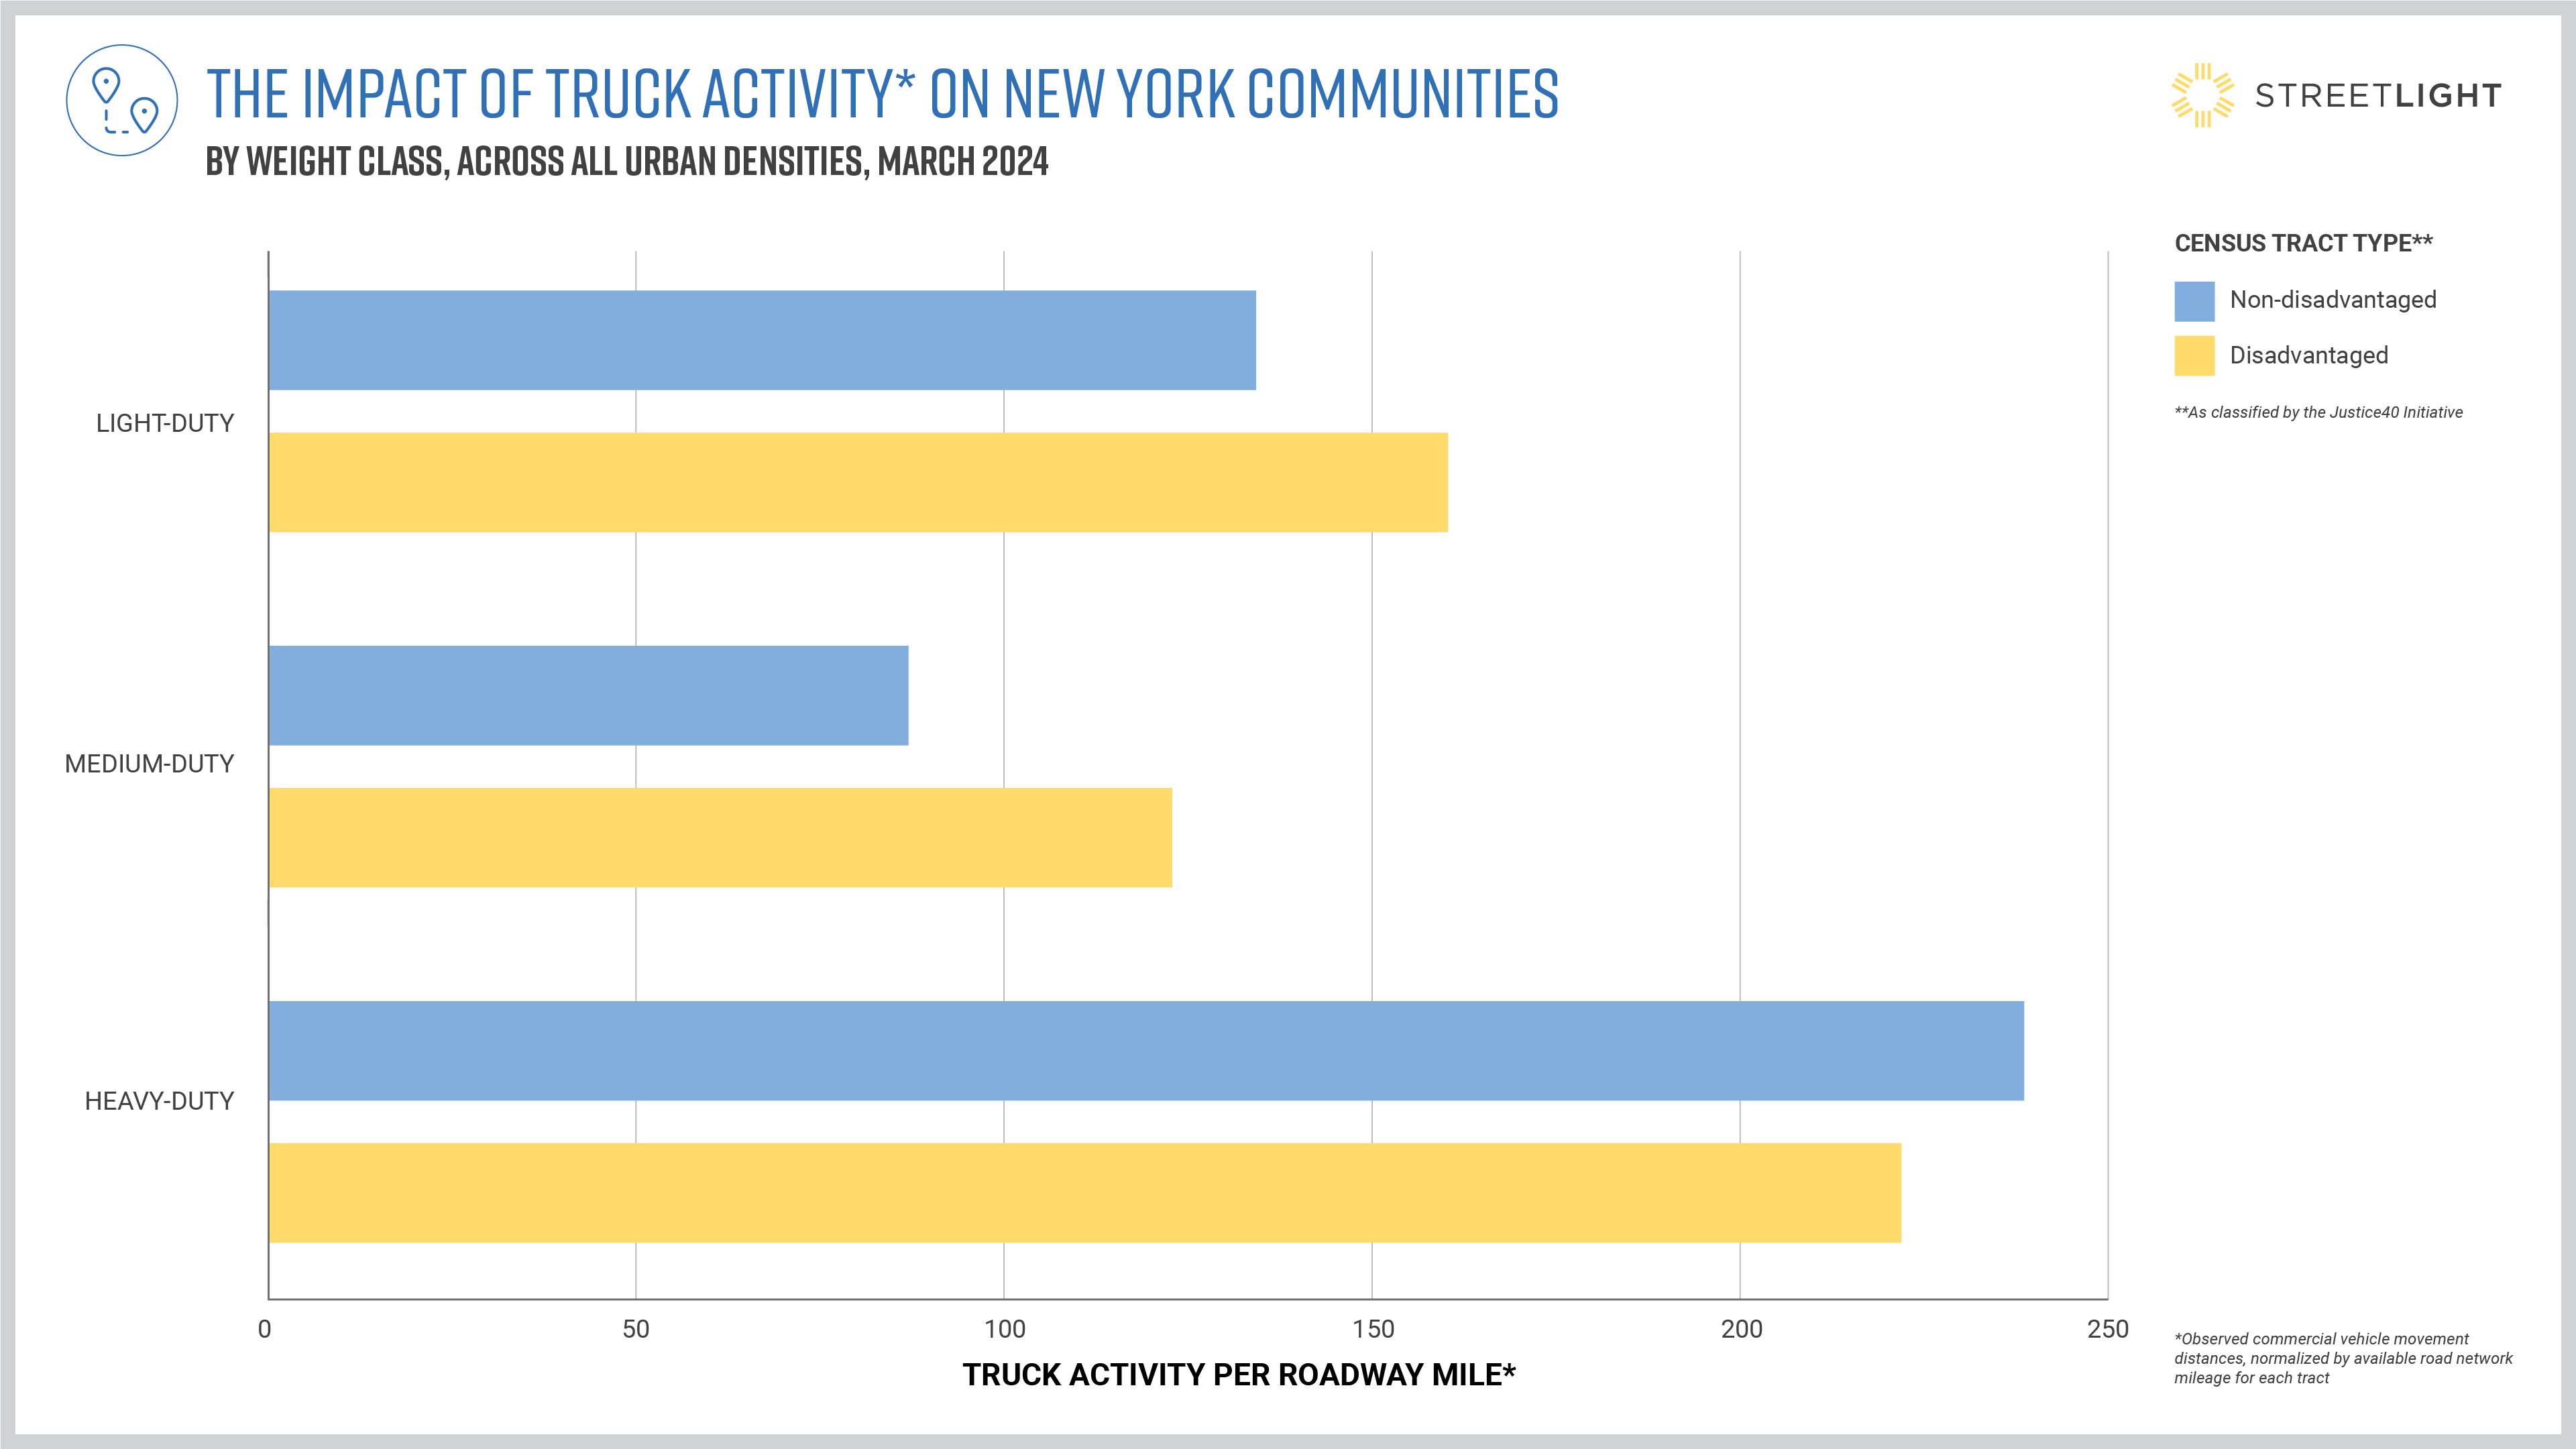
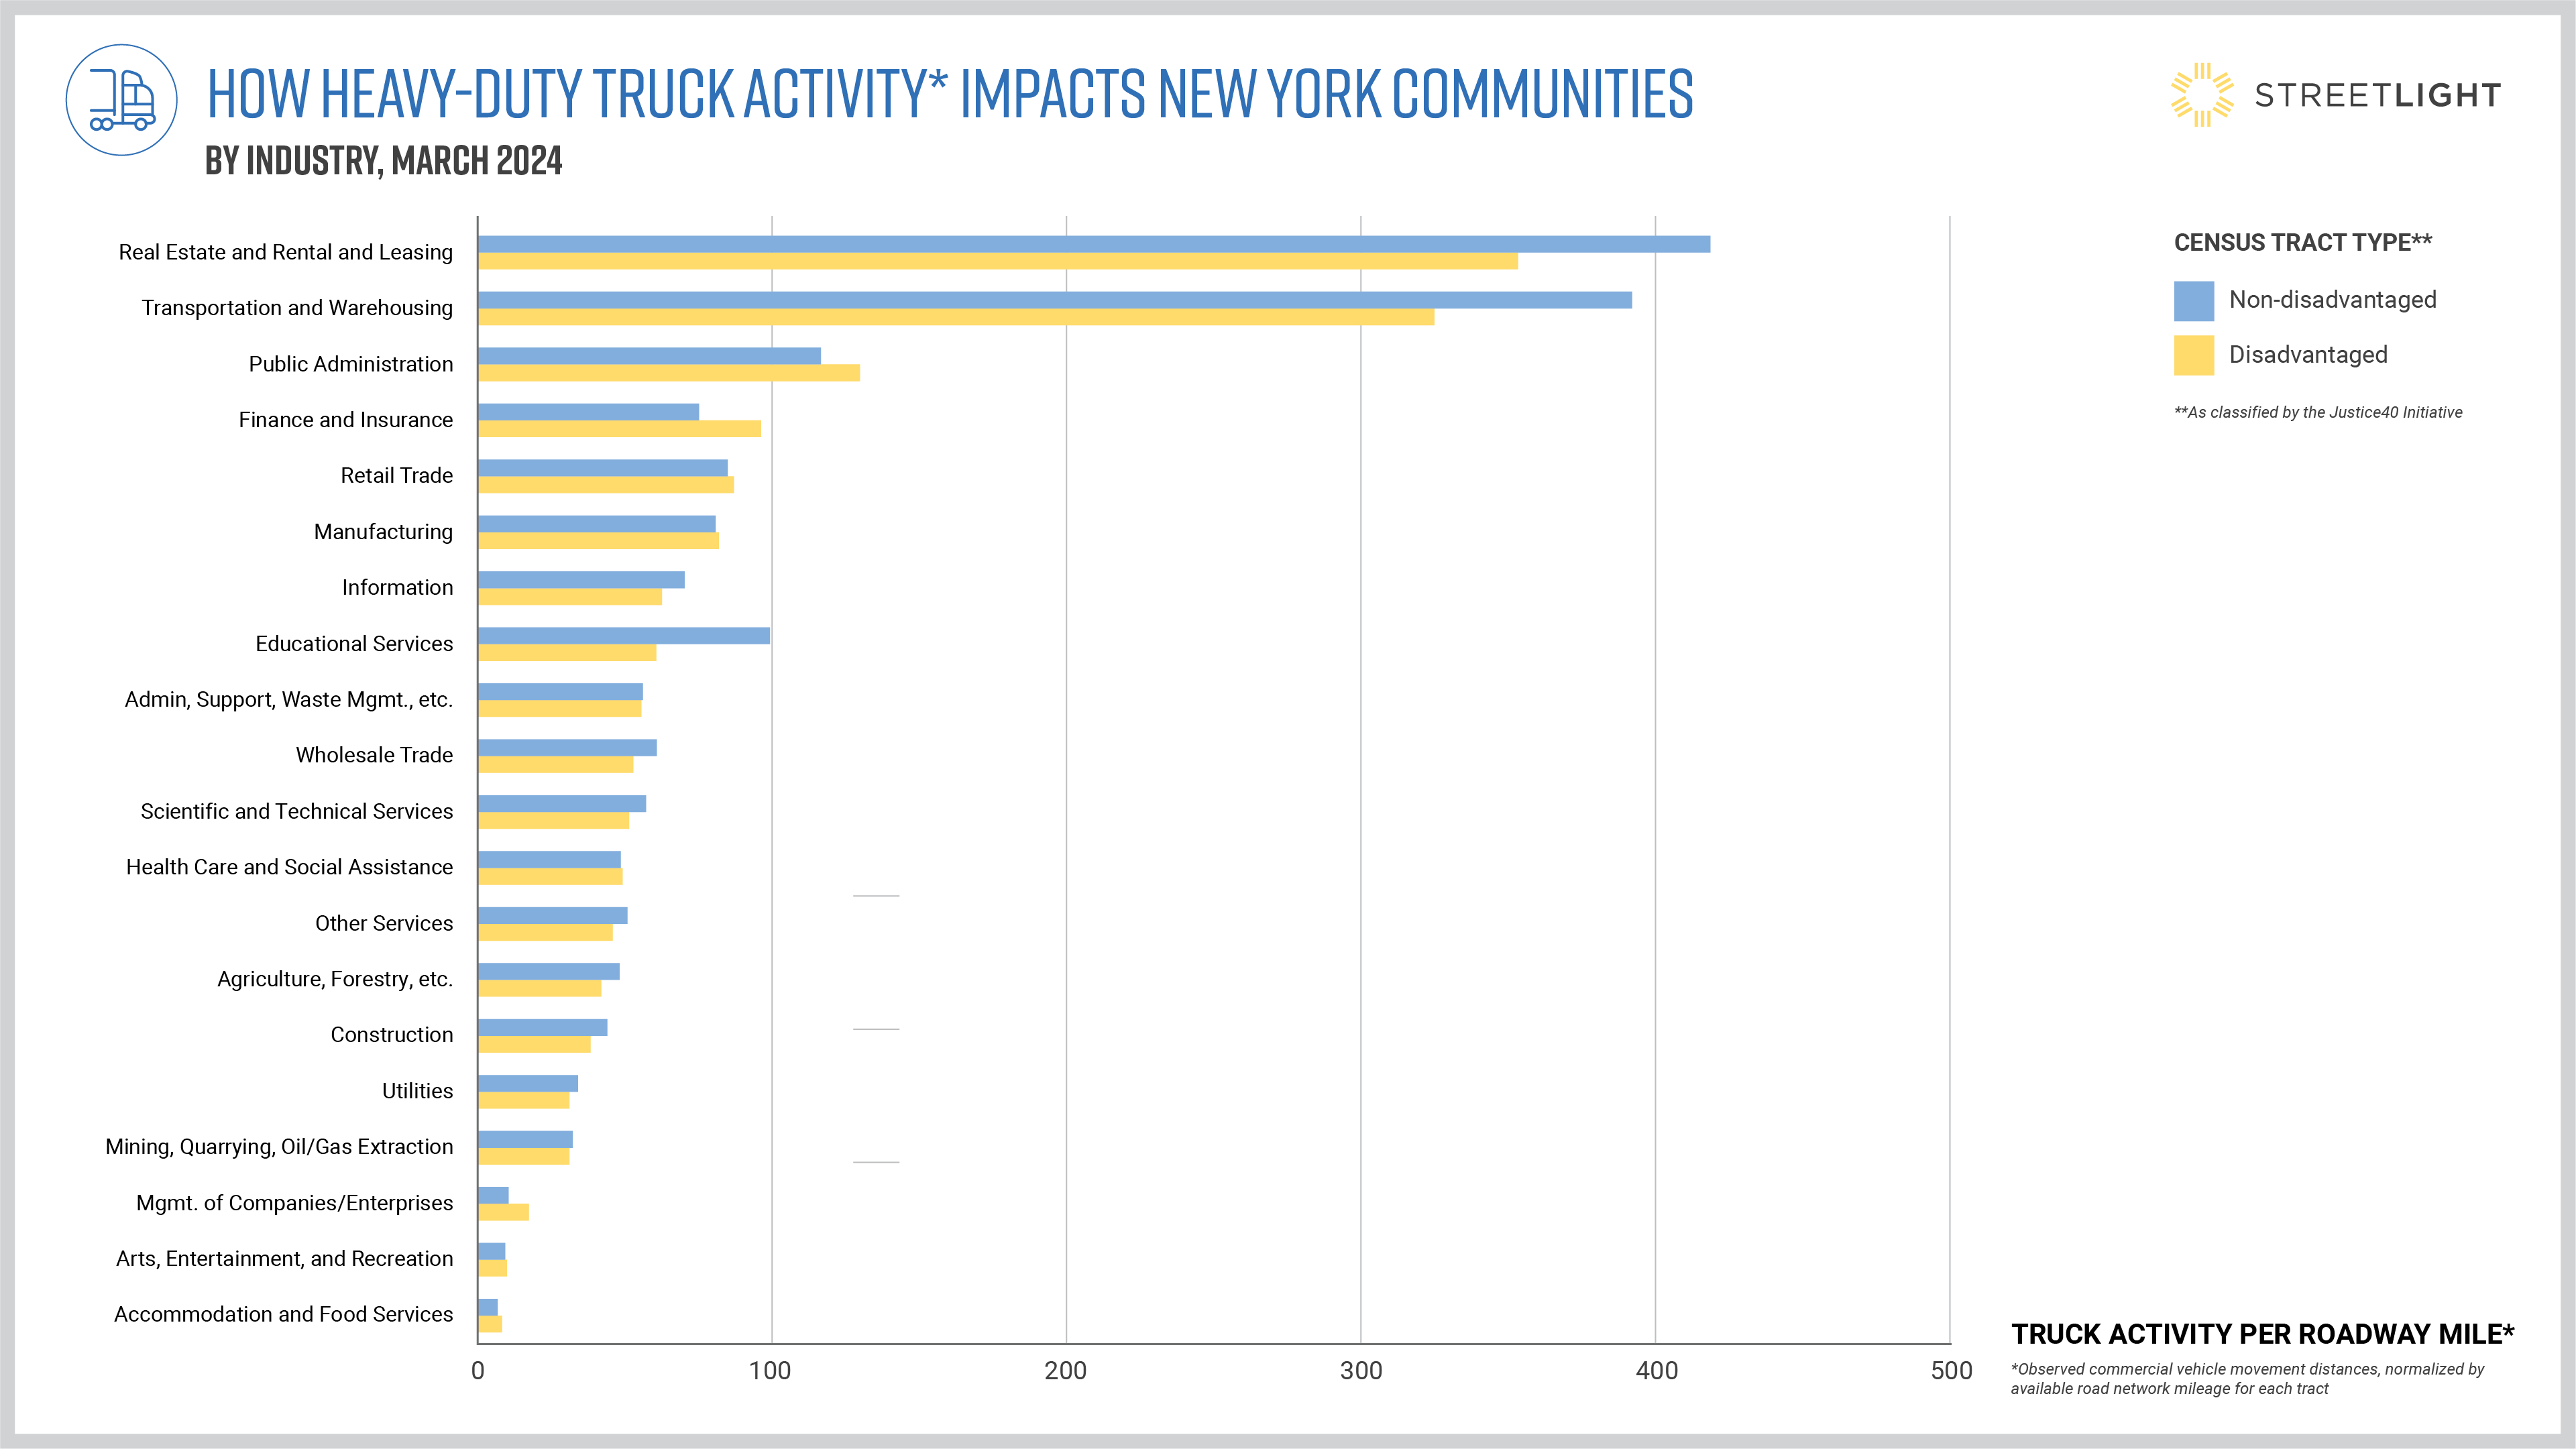
To unpack the impact of trucks on DACs. vs. non-DACs, StreetLight’s analyzed truck activity in New York state by weight class and how it differed in these community types. Streetlight finds that light-duty and medium-duty truck activity have a disproportionate impact on disadvantaged communities per mile. Meanwhile, heavy-duty activity per roadway mile is slightly higher within non-DACs.
Truck Activity Per Roadway Mile is segmented by commercial vehicle weight class to compare trucks’ impact on DACs vs. non-DACs. See our Methodology section at the end for more details.
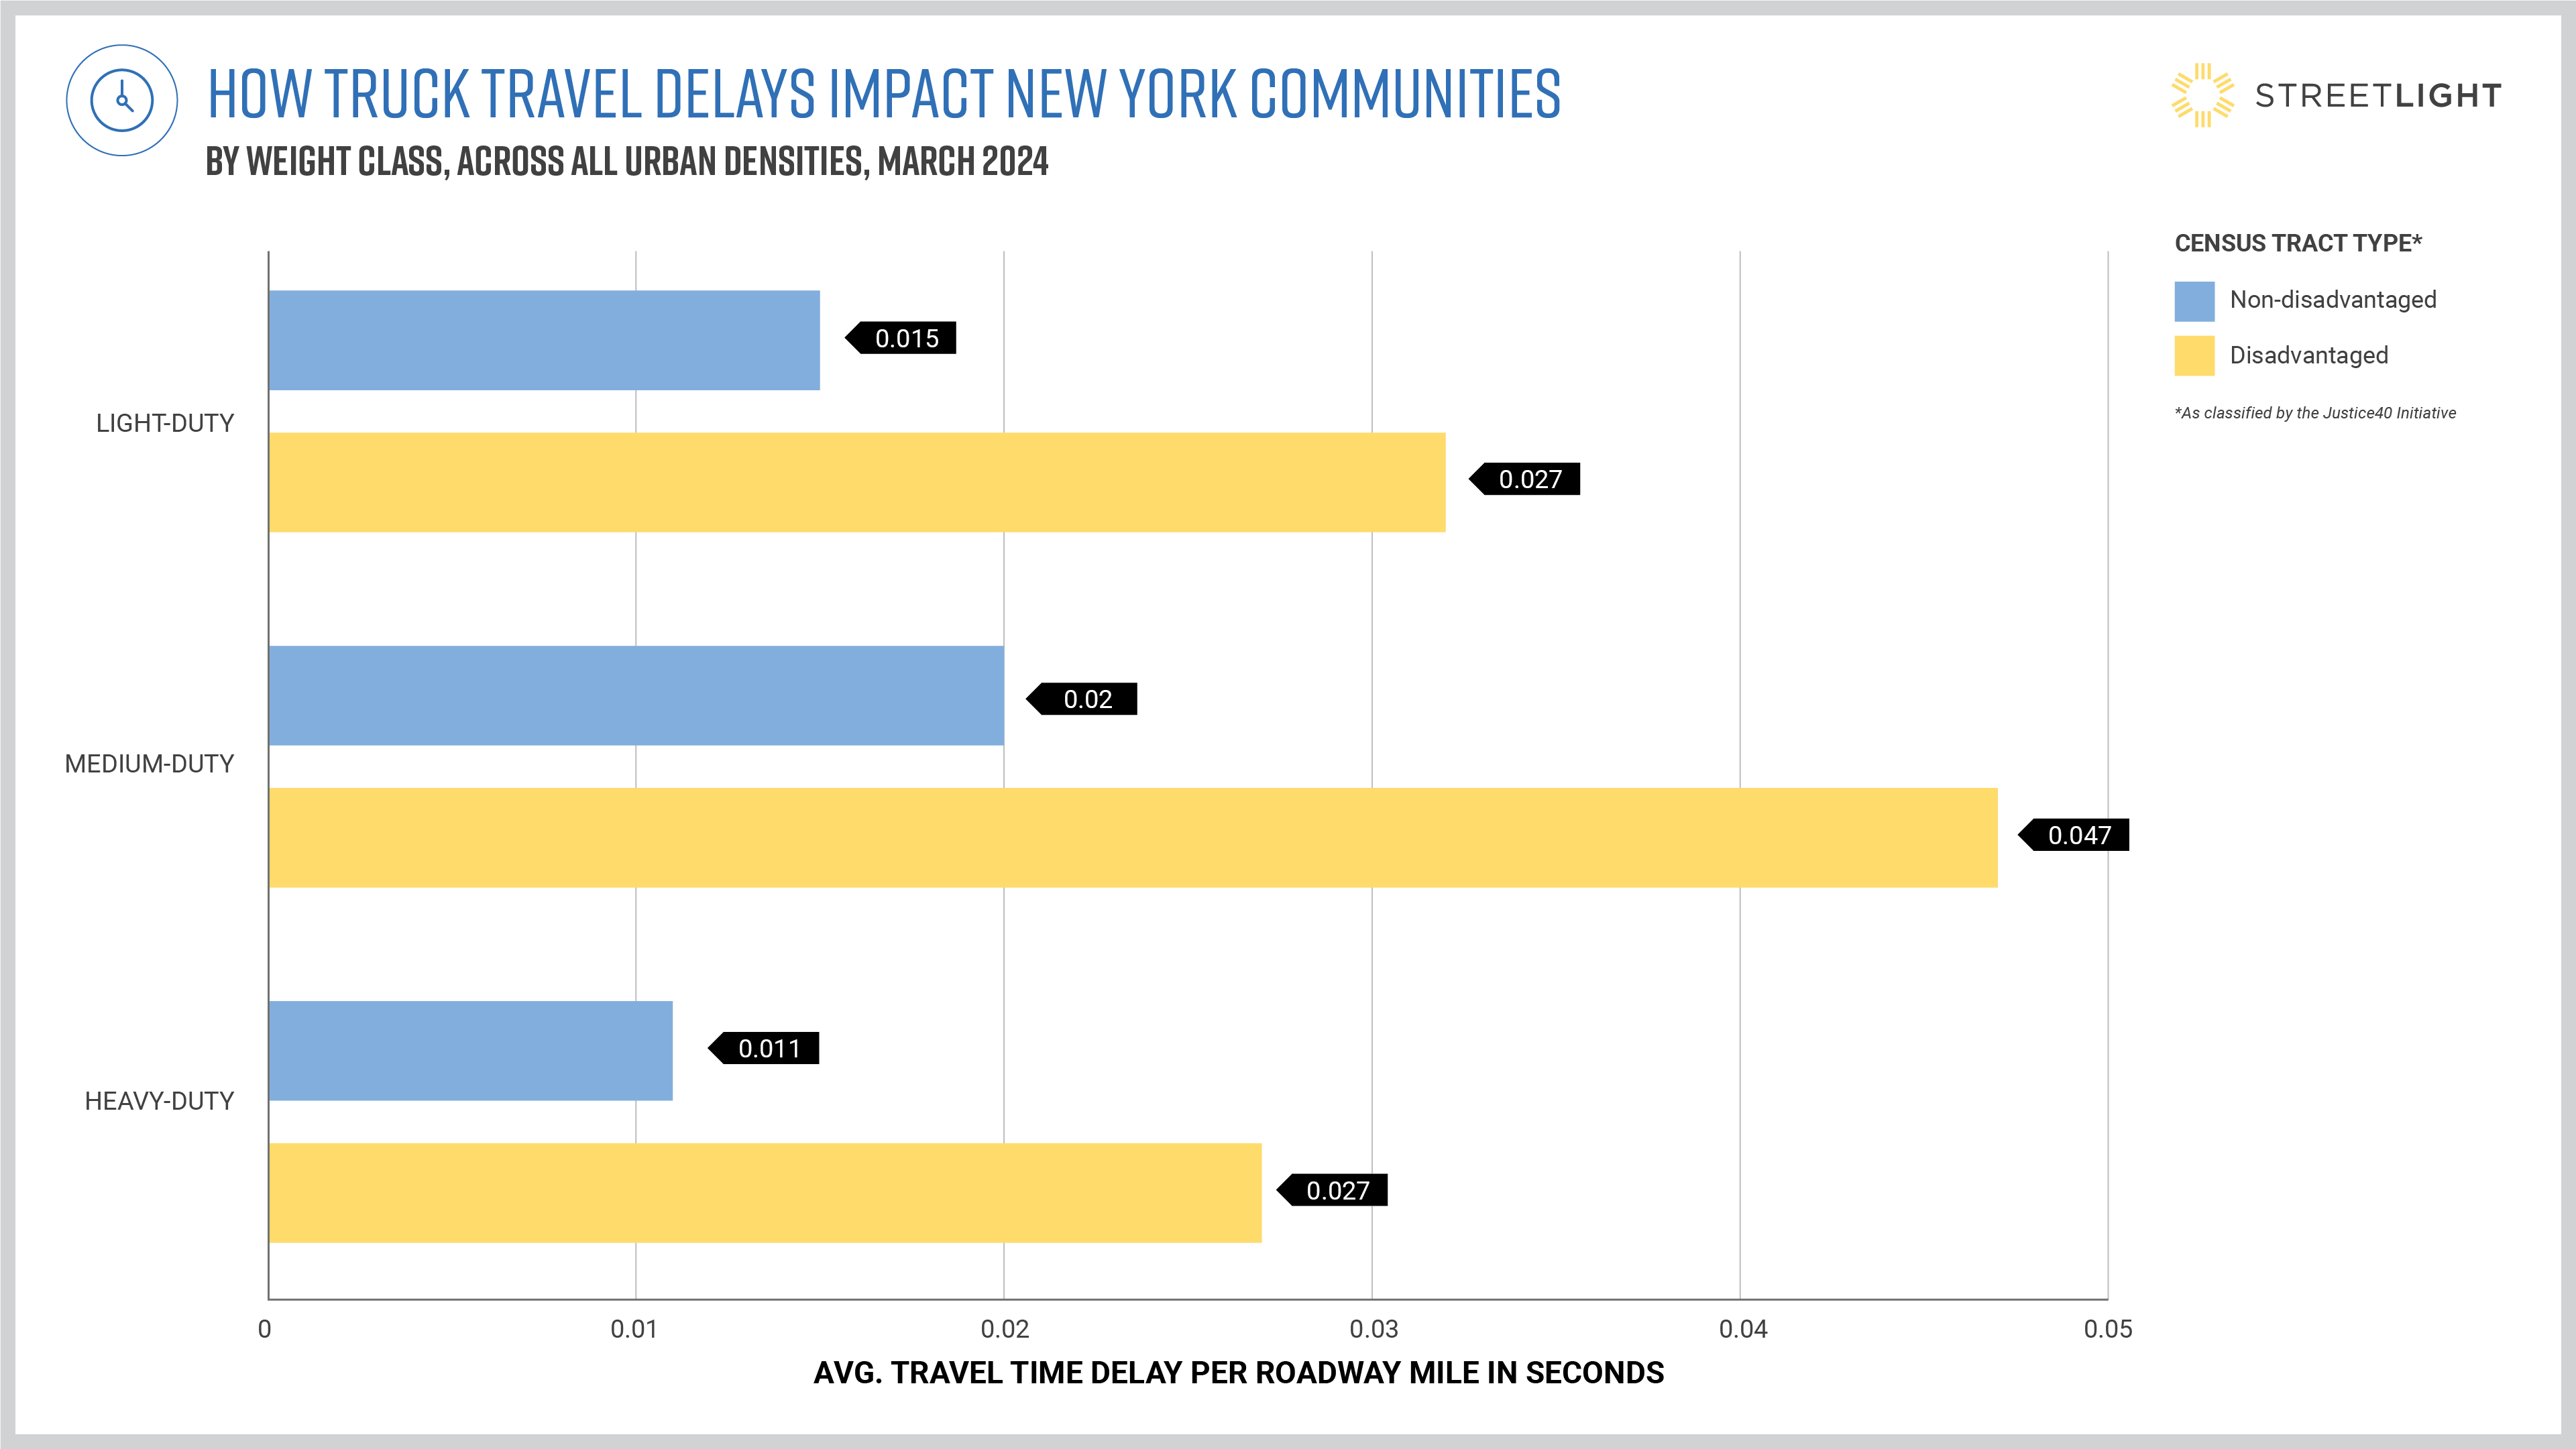
Going further and factoring in travel delays among trucks, the picture changes substantially.
The chart below illustrates the inequitable impact of congestion, with DACs encountering significantly more traffic delays per roadway mile, even among truck classes that have a lesser presence in DACs compared to non-DACs. In fact, DACs are faced with more traffic delays across every class of truck, suggesting that DACs may also be exposed to disproportionately high emissions from both gas-powered and diesel-powered trucks as these vehicles linger through delays, contributing to poor health outcomes.
Measuring the average delay from free-flow speed per roadway mile reveals that traffic delays impact disadvantaged communities significantly more, regardless of which classes of truck are driving in their community.
While trucks are not necessarily the cause of these traffic delays, congestion mitigation efforts can still help reduce the impact that trucks — and indeed all vehicles — have on the communities they travel through.
Because these delays are averaged across the entire available roadway network, the per-mile delay impacts appear small. Nevertheless, the fact that average delays are higher for DACs than non-DACs suggests that analyzing congestion is a worthy step when evaluating the impact of truck traffic within disadvantaged communities.
While traffic delays are a nuisance for communities in and of themselves, lengthening commute times and making it harder to access essential goods and services, delays also intensify other negative impacts of vehicle activity like emissions and air pollution.
Where TruckDelays Have the BiggestImpact by Density
For agencies to manage truck activity in a way that improves transportation equity, it’s also important to understand that DACs are diverse in makeup, as are non-DACs – no two communities look exactly the same. For example, urban density can have a significant impact on how communities are impacted by trucks.
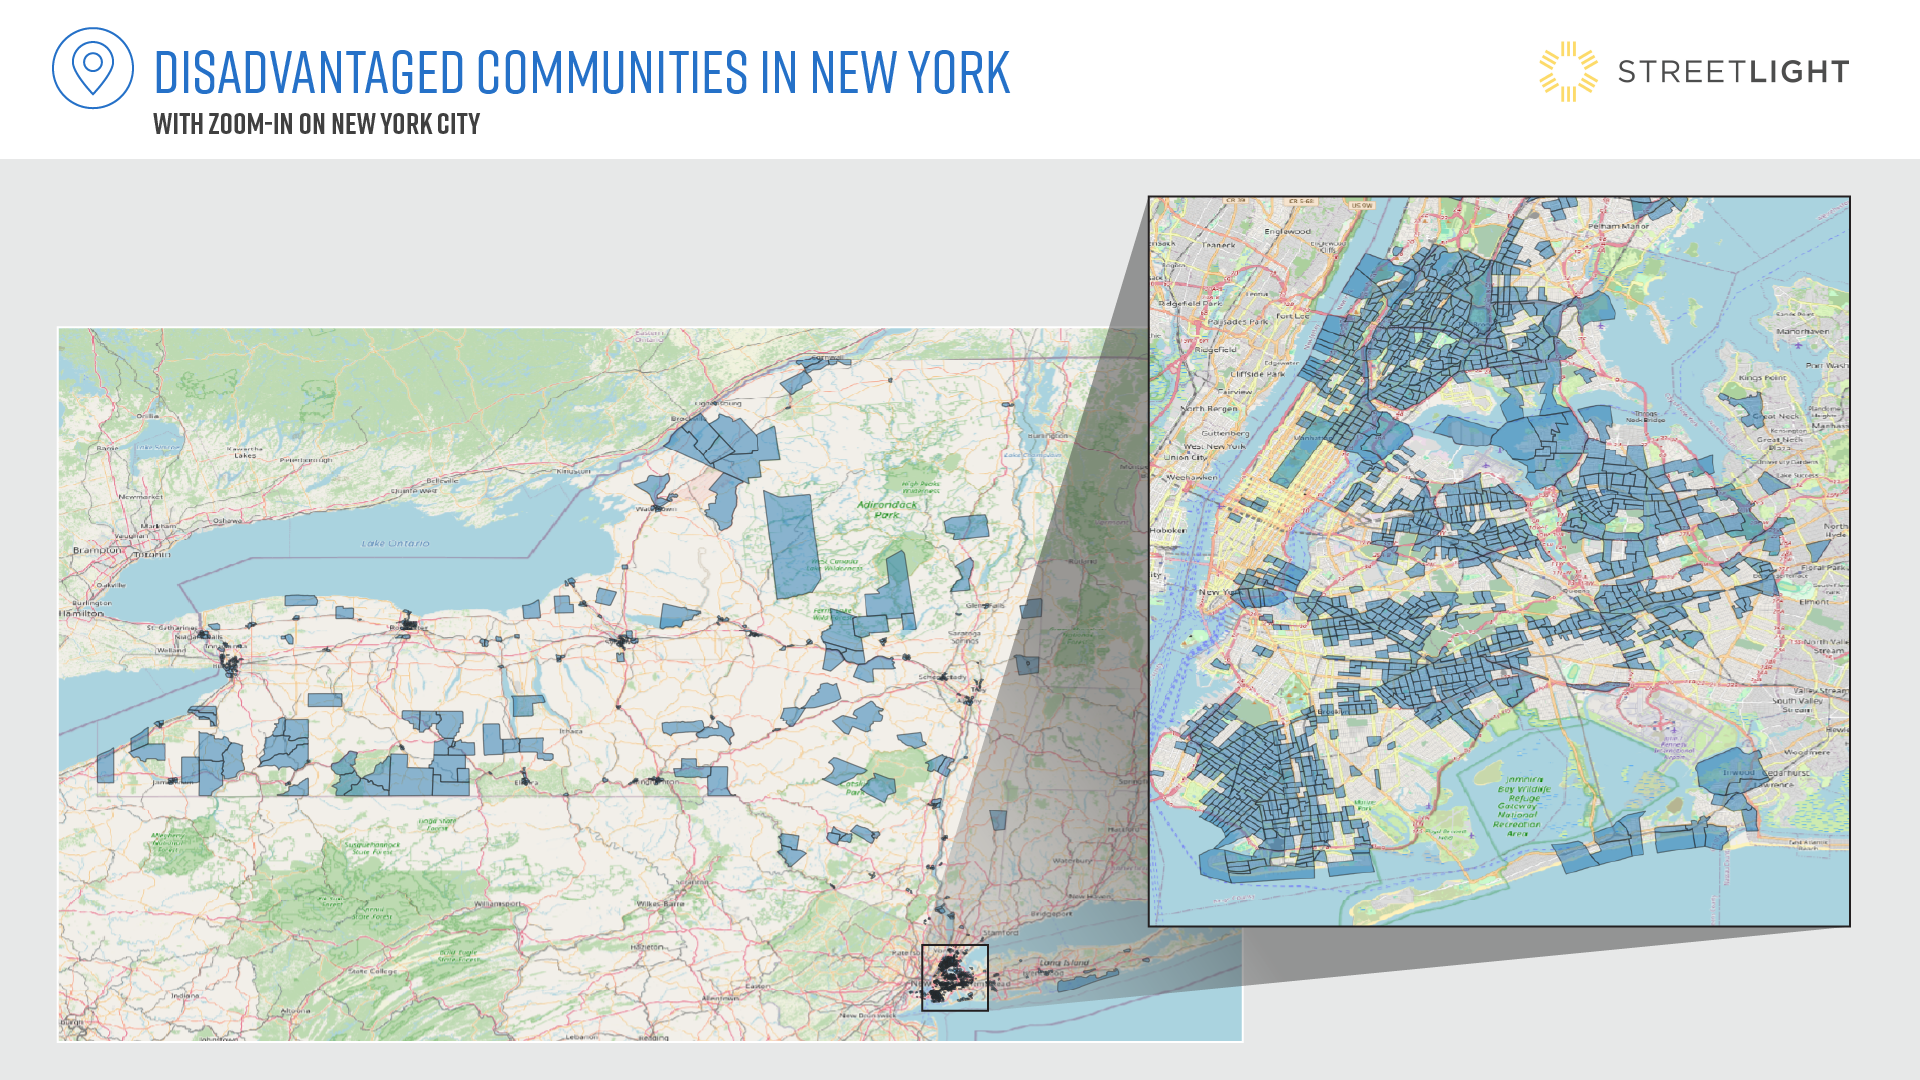
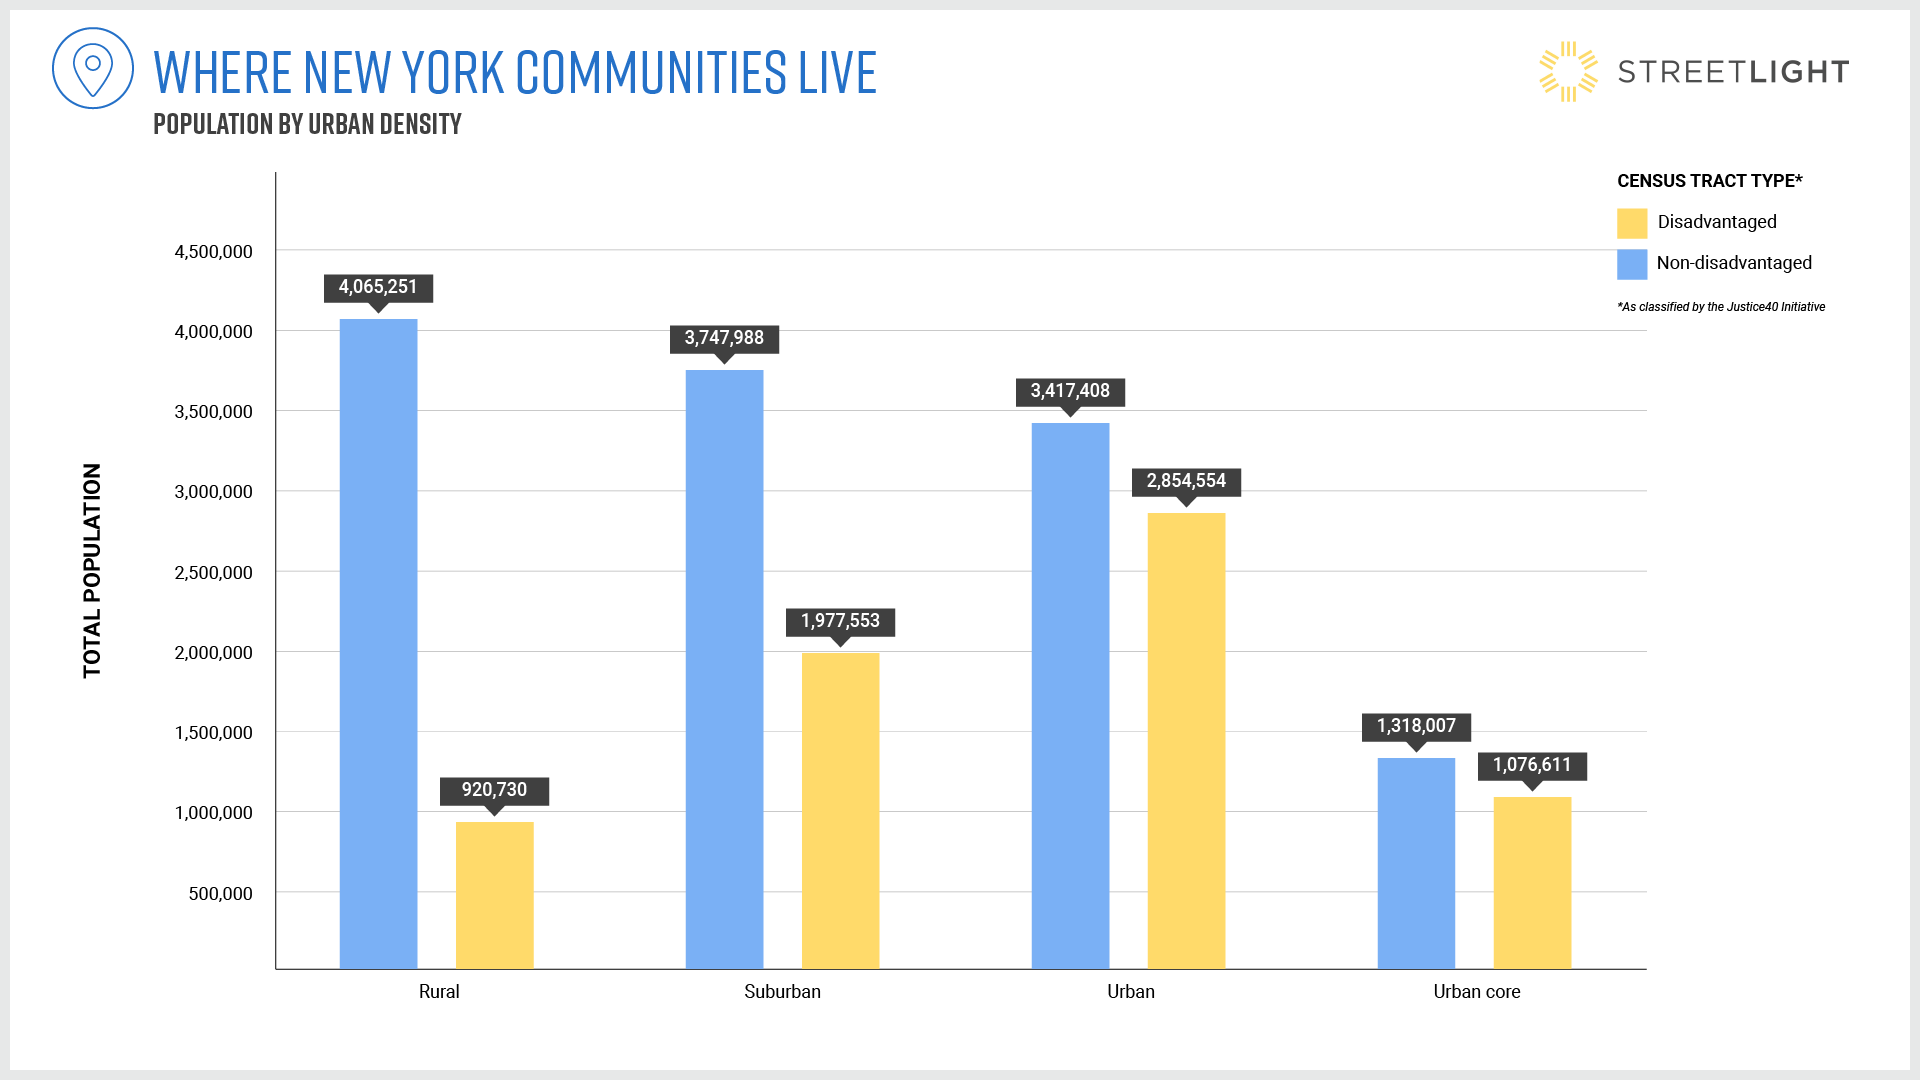
To understand these nuances, let’s first establish how DACs are distributed across different urban densities – from rural locations to the urban core.
The map above highlights important nuances to consider when comparing census tracts—firstly, rural census tracts cover far more area, and therefore far more roadway network miles, than urban tracts. For this reason, StreetLight normalizes Truck Activity by roadway mile for this analysis (see Methodology section for more details).
Furthermore, the map shows that DACs are concentrated in urban areas. Zooming in on New York City reveals just how many DACs call the city home compared to rural areas throughout the state. The chart below explores this distribution by population.
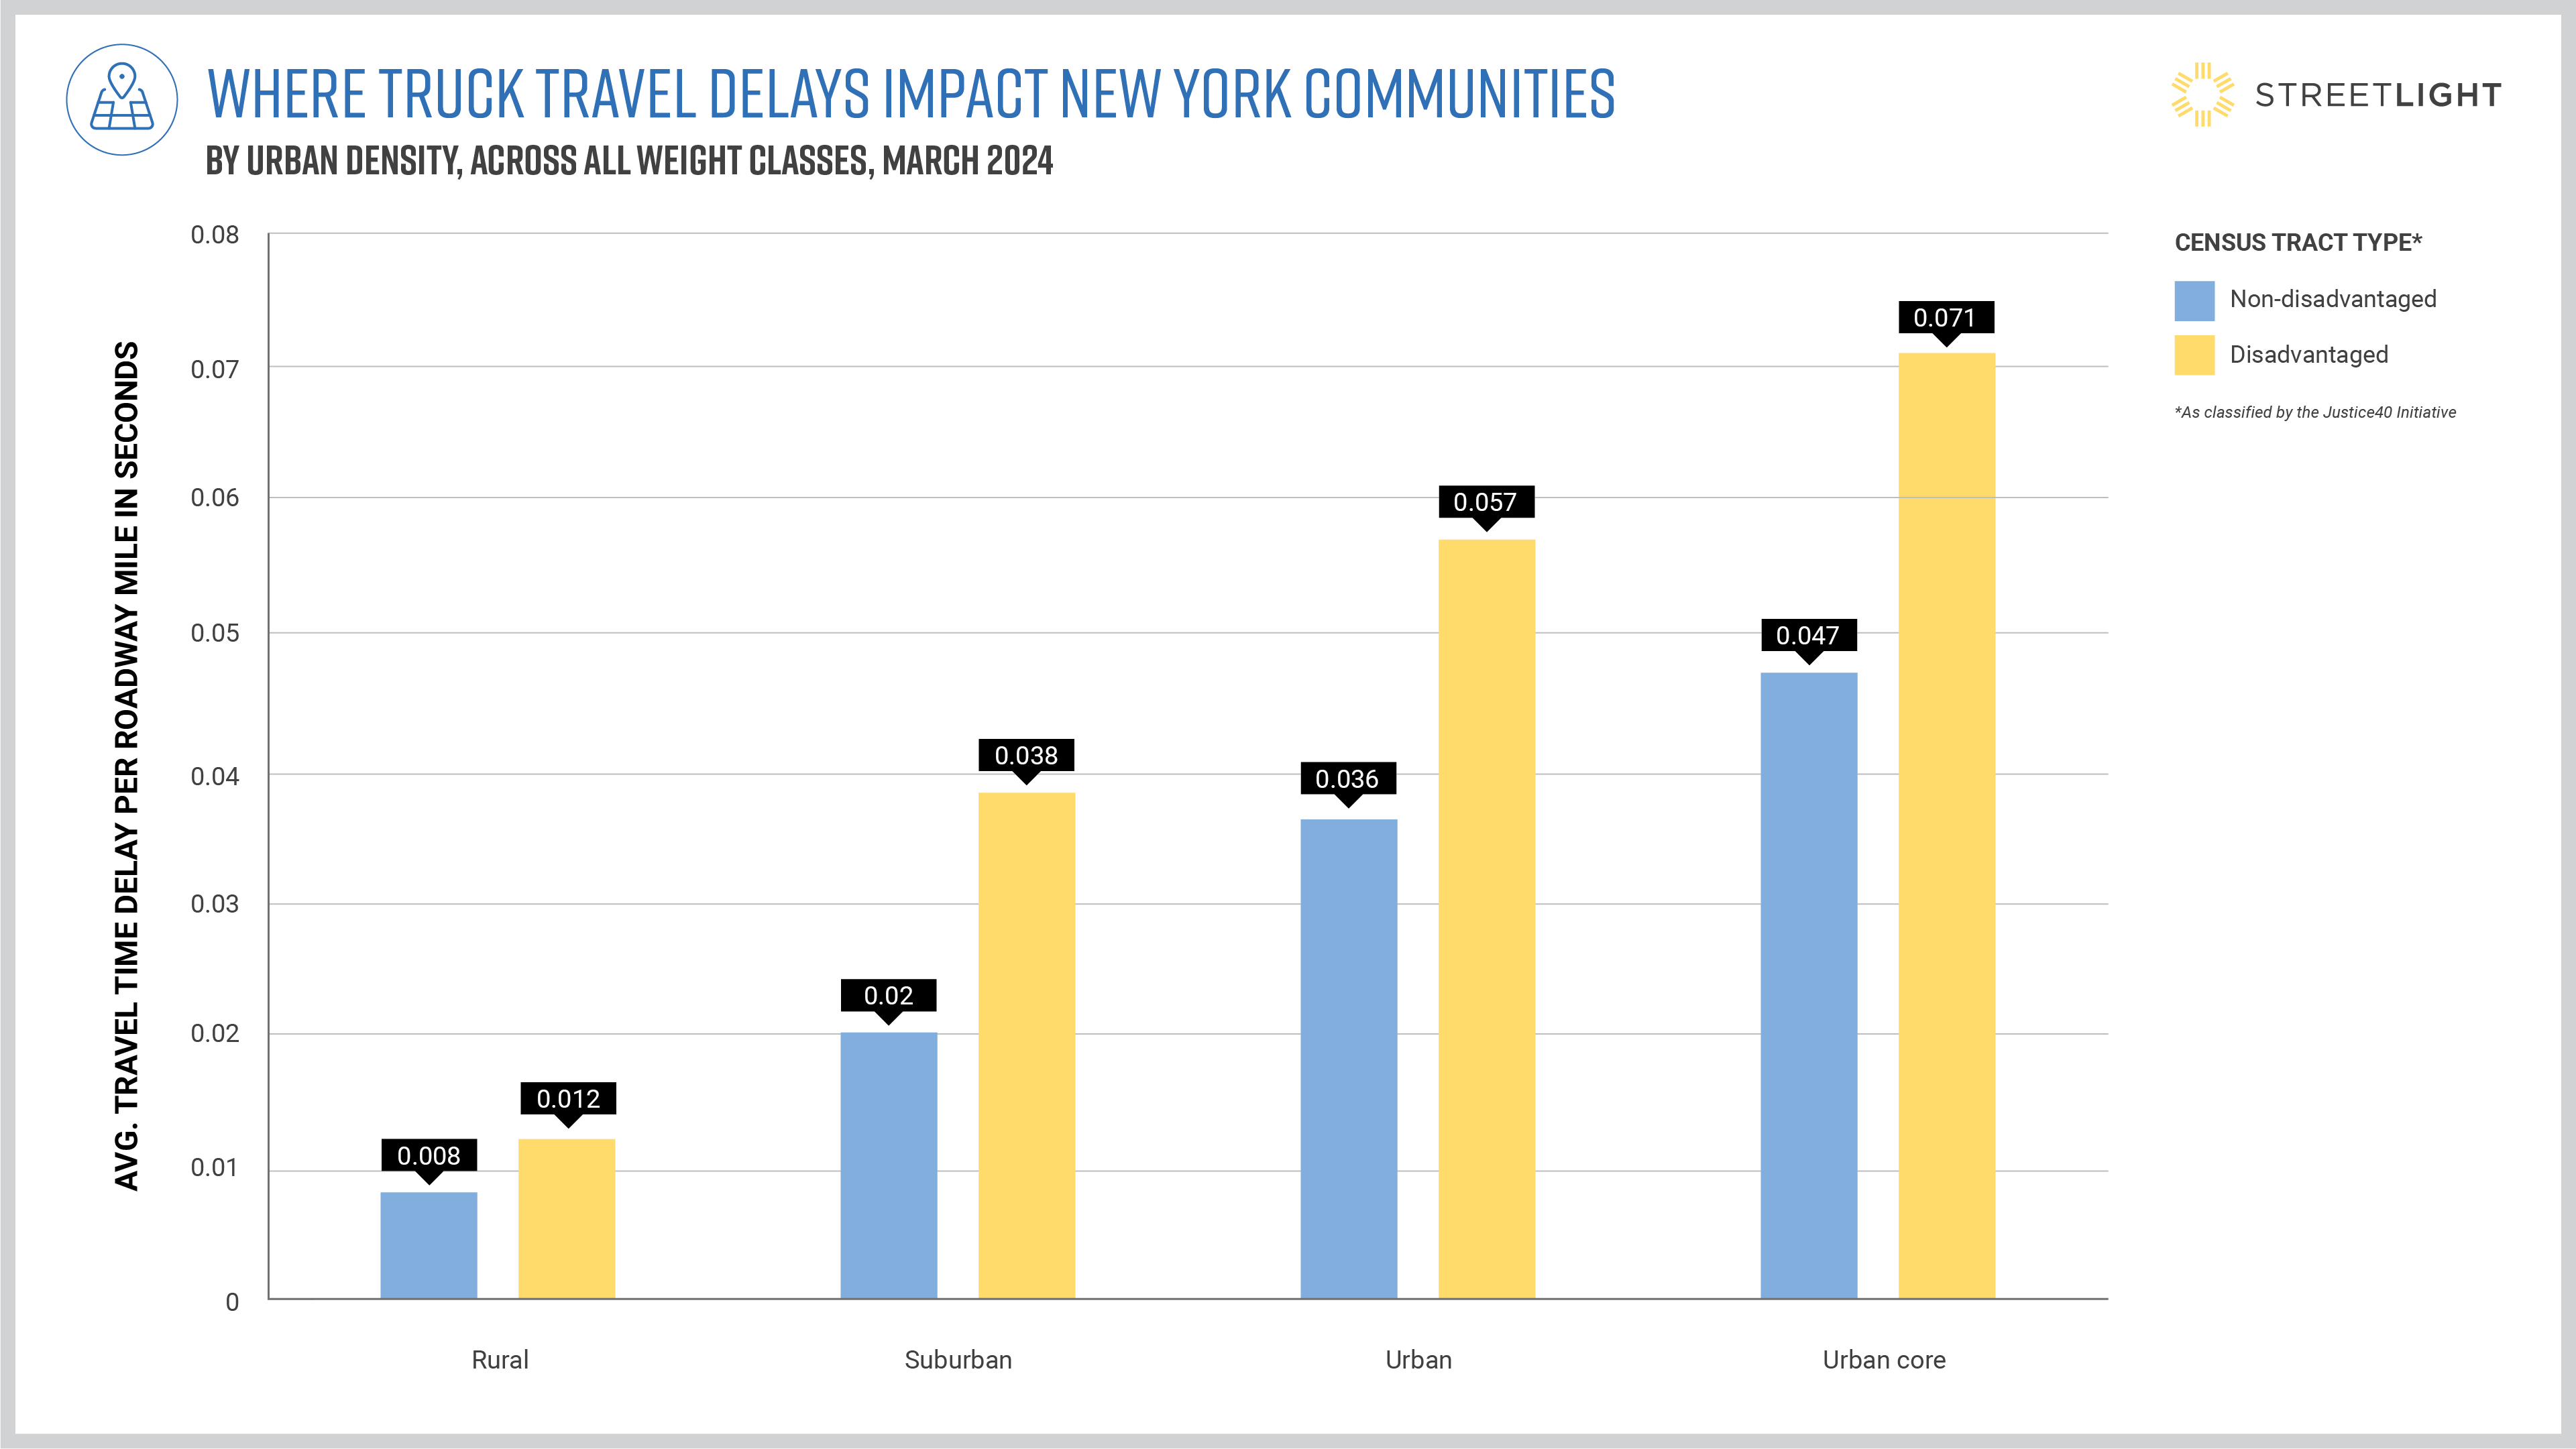
Since DACs are concentrated in urban areas, you might expect to find that truck delays are only an issue for DACs in urban and urban core locations.
However, in the chart below, we can see that while delays are worse in urban DACs, even in rural and suburban areas, DACs are impacted by more travel time delays than their non-DAC counterparts, highlighting the importance of targeting congestion mitigation efforts and improving freight planning within disadvantaged communities across all urban densities.
How Different Truck Weight Classes Impact Communities
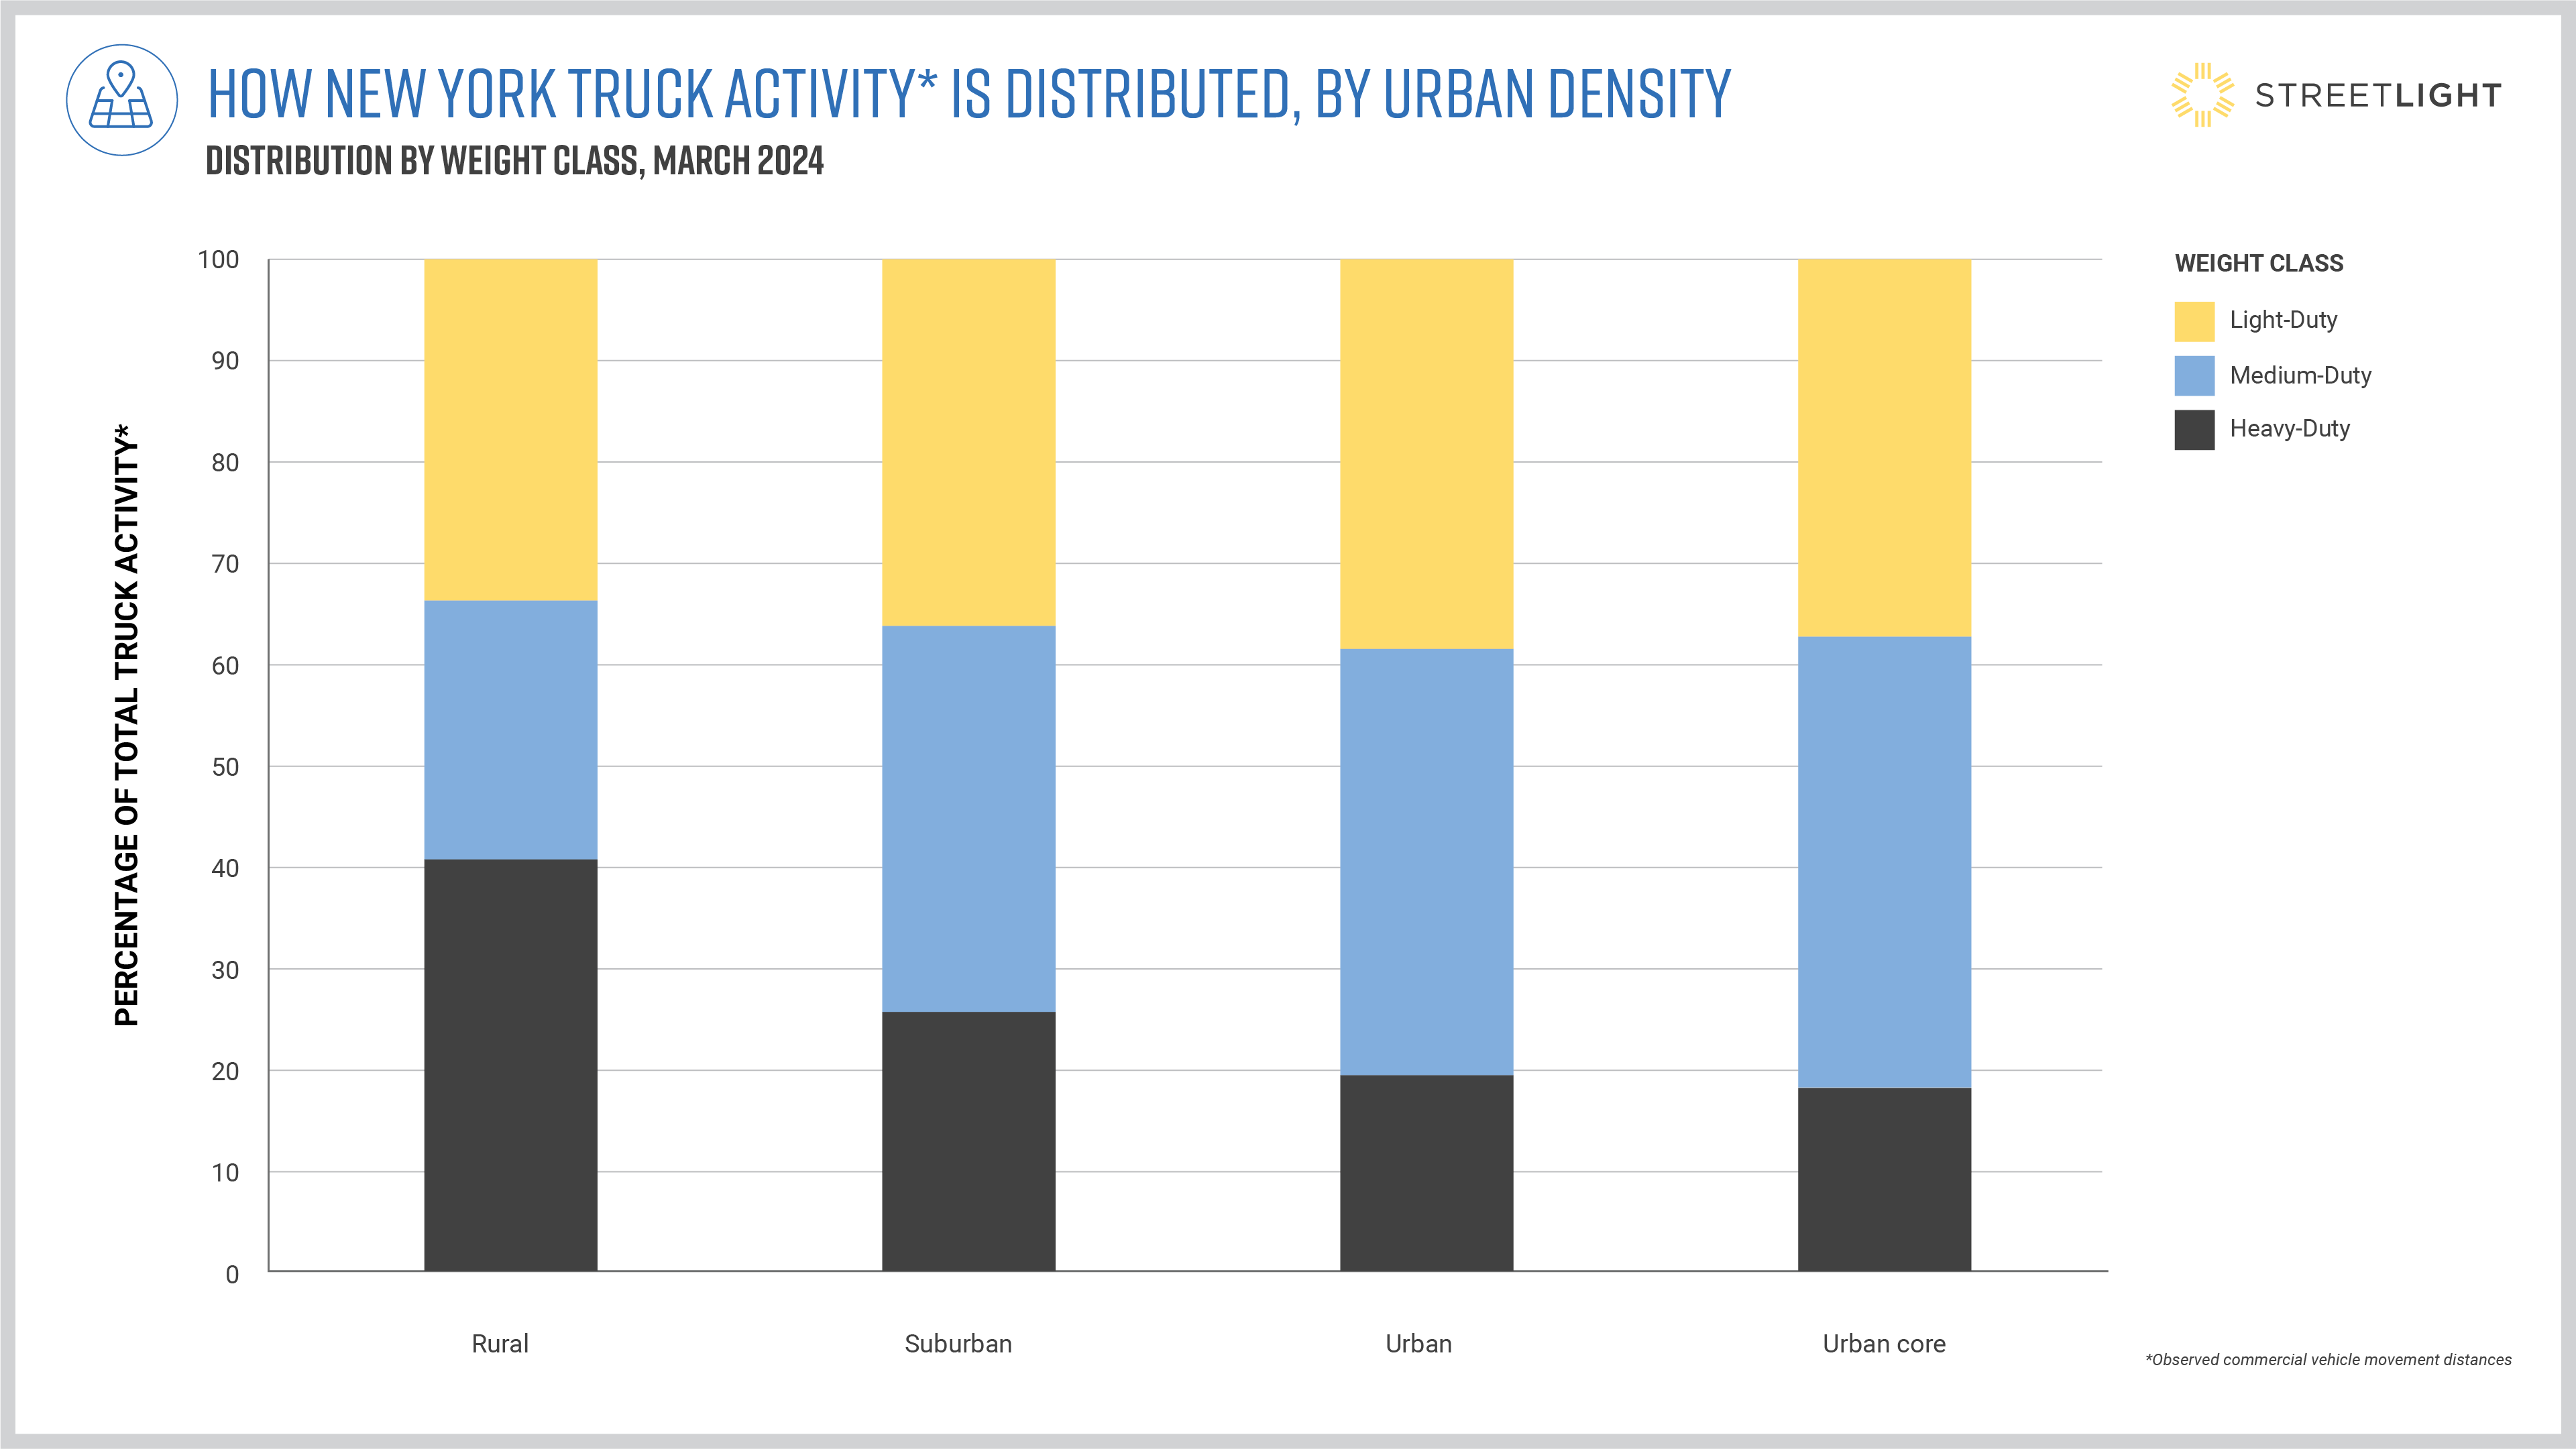
To further contextualize StreetLight’s truck findings by density, let’szero in on the roles different truck weight classes play in each type of tract.
Truck Weight Class Distribution by Urban Density
How Different Industries Contribute to Truck Impact, by Weight Class
Given the disproportionate impactmedium-duty vehicles have on DACs by overall activity, and especially when factoring in travel delays, it’shelpful to understand what roles these vehicles play in communities, and which industries drive medium-duty truck activity.
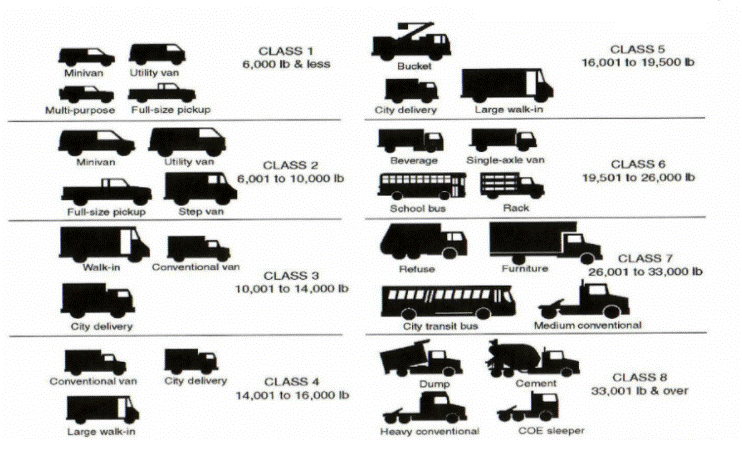
As the image above depicts, commercial vehicles range from class 1 to class 8, with classes 1 and 2 considered “light-duty” vehicles, ranging from commercial vans to pickup trucks. Classes 7 and 8 are “heavy-duty” vehicles, including garbage trucks, city transit buses, and traditional semi-trailer trucks. Everything in between (classes 3-6) is considered “medium-duty,” ranging from local delivery trucks to school buses.3
Based on mileage, medium-duty truck activity in New York’s DACs is predominantly comprised of Public Administration and Transportation and Warehousing vehicles, with Real Estate and Rental and Leasing (the front-runner for medium-duty activity in non-DACs) trailing just behind.
Meanwhile, Real Estate and Rental and Leasing and Transportation and Warehousing also make a strong showing within the heavy-duty vehicle activity breakdown.Although heavy-duty vehicles show more truck activity per roadway mile within non-DACs compared to their DAC neighbors, these trucks still have a significant impact on DACs, especially as they contribute more emissions and noise pollution per mile traveled compared to smaller trucks. For this reason, understanding the industry breakdown among heavy-duty trucks could also generate valuable lessons for equity-focused freight planning.
Based on these findings, medium- and heavy-duty trucks serving the transportation and warehousing industrycould warrant special attention from freight planners. These trucksoften travel to and from larger hubs of freight activity, such as distribution warehouses and ports, making communities impacted by these high-traffic freight routes that much more likely to experience air and noise pollution due tonearby truck activity. Moreover, much of this truck traffic may not be ending in these communities, merely passing through. For this reason, the Bipartisan Infrastructure Law (BIL) provides special funding opportunities for decarbonization efforts that target ports.4
Key Takeaways for Managing Truck Traffic Impacts
To improve outcomes for disadvantaged communities, planners must consider the inequitable impacts of truck traffic as they work to mitigate congestion, reduce emissions, and route trucks efficiently.
StreetLight’s analysis highlights that some classes of truck impact DACs more than their non-DAC counterparts, suggesting that analyzing this truck activity and targeting electrification efforts toward these weight classes and industries in particular may help address inequitable impact and target the most impactful improvements.
Additionally, the analysis shows traffic delays are a problem disproportionately impacting DACs across all urban densities, but especially in the urban core. Though these delays are not necessarily caused by trucks themselves, they can exacerbate the impacts trucks have on local emissions and air quality, making efforts to mitigate congestion and route trucks more efficiently in disadvantaged communities especially critical.
Finally, the Transportation and Warehousing industry emerges as a significant contributor to trucks’ impact on disadvantaged communities. This industry could warrant special attention from planners or businesses looking to address freight’s equity impact. And for businesses with large logistics operations, placing emphasis on improved routing and electrification could mitigate congestion and emissions impacts on disadvantaged communities.
This analysis includes truck data for March 2024 within the state of New York, including residential roadways.
To measure Truck Activity, StreetLight analyzes sample Vehicle Miles Traveled (VMT) for commercial vehicles per mile of available roadway network in each census tract.
To analyze traffic delay, StreetLight uses a weighted average of travel time delay per mile of available roadway network in each of the urban density and DAC/non-DAC categories. The weight is the segment truck sample count, so that segments with higher numbers of trips have their delay represented proportionately. In other words, the travel time delay value for each of these categories represents how much delay a driver can expect when travelling one mile within that category.
StreetLight analyzes the urban density of census tracts based on the density of their roadway networks.
Census tracts are labeled “disadvantaged” vs. “non-disadvantaged” based on how they are classified by the Justice40 Initiative. In general, census tracts labeled “disadvantaged” meet a threshold for “environmental, climate, or other burdens” and “an associated socio-economic burden.”5
1. USDOT Bureau of Transportation Statistics. “Freight Activity in the U.S. Expected to Grow Fifty Percent by 2050.” November 22, 2021. https://www.bts.gov/newsroom/freight-activity-us-expected-grow-fifty-percent-2050
2. The White House. “Justice40, a whole-of-government initiative.” https://www.whitehouse.gov/environmentaljustice/justice40/
3. U. S. Department of Energy, Alternative Fuels Data Center. “Maps and Data – Vehicle Weight Classes & Categories.” https://afdc.energy.gov/data/10380
4. Office of Energy Efficiency & Renewable Energy. “Federal Funding Opportunities for Port Low- to Zero-Emissions Technologies.” https://www.energy.gov/eere/federal-funding-opportunities-port-low-zero-emission-technologies
5. Office of Energy Justice and Equity. “Justice40 Initiative.” https://www.energy.gov/justice/justice40-initiative
Ready to investigate trucks' equity impact in your community?
The Data Behind How Speed Cameras Curbed Crash Rates on One of Philadelphia’s Most Dangerous Roads
The Data Behind How Speed Cameras Curbed Crash Rates on One of Philadelphia’s Most Dangerous Roads
To fix deadly speeding on one of America’s most dangerous roads, Philadelphia installed speed cameras along eight sections of Roosevelt Blvd. Now, before-and-after analysis by StreetLight reveals how effective the strategy really was, and whether it could save lives in other cities.
Roosevelt Boulevard (US Route 1) in Philadelphia, PA has been dubbed one of America’s most dangerous roads. This twelve-lane highway is host to both local and commuter traffic, with at-grade express and local lanes traveling along its length.
Dozens of crashes resulting in severe injury or death occurred on the boulevard in 2020 alone, many of them involving pedestrians. [1] And because Northeast Philadelphia is home to a number of densely populated disadvantaged communities, the victims this boulevard claims are disproportionately people of color, whose communities have long been bisected by these twelve lanes of fast-moving vehicles.
In 2020, the city took measures to address the boulevard’s high crash rates, installing speed cameras along eight sections of Roosevelt Blvd. To understand how these cameras impacted safety conditions on the corridor, StreetLight used its transportation data platform to analyze vehicle speeds before and after the camera installation, looking at data from before COVID, during the pandemic, and as recently as 2024.
Then we investigated where high vehicle speeds persist on the boulevard, revealing potential locations for the next set of traffic calming interventions.
In this article, we’ll explore:
Roosevelt Boulevard’s speed problem
What Philadelphia is doing to reduce speeding
Whether speed cameras made Roosevelt Blvd safer (and how much)
How cities can choose the right traffic calming measures and evaluate their impact
Roosevelt Boulevard’s Speed Problem
At the heart of Roosevelt Blvd’s high crash rates is a history of dangerous vehicle speeds. Although the posted speed limit for much of the highway is 45 miles per hour, residents have complained that drivers on Roosevelt Blvd routinely exceed this limit. In one extreme case in 2013, four pedestrians, including three children, were struck and killed by two motorists traveling over 40mph above the posted speed limit. [2]
Data from PennDOT corroborates residents’ testimony, indicating that prior to 2020, 55% of crashes on the boulevard were attributed to speeding and aggressive driving.
A number of factors make the boulevard’s speed problem particularly deadly. Surrounding the 12-lane freeway, a growing population of Northeast Philadelphians generate significant pedestrian traffic as they access goods and services from the businesses that call Roosevelt Blvd home. Because many of these residents are from Disadvantaged Communities (DAC), they are also less likely to have access to a car, making them reliant on more vulnerable modes of transportation like walking and biking.
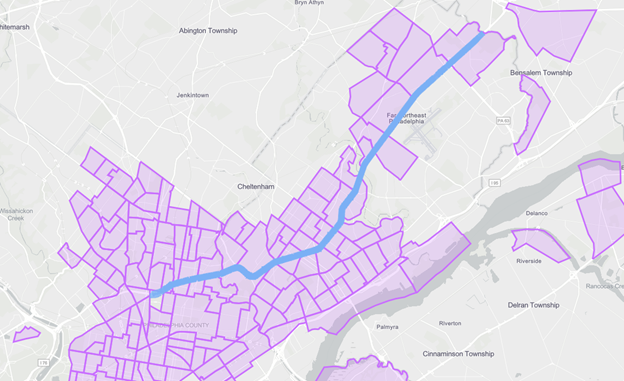
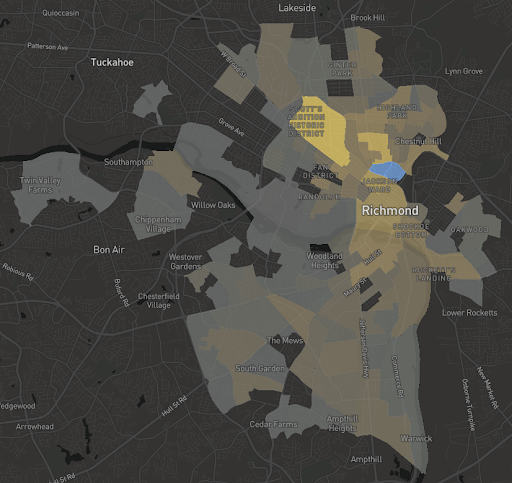
In the image below, StreetLight’s Justice 40 map layer highlights in purple the many Disadvantaged Community census tracts that surround Roosevelt Blvd.
Roosevelt Boulevard (in blue) is flanked by clusters of Disadvantaged Communities (in purple), shown by the StreetLight Insight® Justice 40 map layer.
Meanwhile, the roadway design has limited infrastructure designed to improve pedestrian safety or slow vehicles, such as pedestrian islands, bulb-outs, or signalized crossings, dramatically increasing the risk pedestrians face on the stroad.
Considering that pedestrians are five times more likely to die from crashes when cars are traveling 40 mph vs. 20 mph, according to data from the AAA Foundation, any vehicle exceeding the boulevards’ posted speed limit of 45 is likely to kill any pedestrian it strikes. [3]
Philadelphia’s Plan to Reduce Speeding
Now for the good news: a number of safety improvement projects are already in the works to address high crash rates on Roosevelt Blvd.
The City of Philadelphia has secured $10 million in state grants from PennDOT to be used on curb extensions, realignments to crosswalks, traffic lanes, and turning lanes, upgraded traffic signals, and other projects. Another $2 million will go toward the planning of future road design improvements as part of the city’s Route for Change program. [4]
While some of these improvements will be completed as far out as 2040, speed cameras offered the city a faster way to curb dangerous vehicle speeds in the short term.
In 2020, the City of Philadelphia, along with the Philadelphia Parking Authority, installed speed cameras along eight particularly dangerous stretches of Roosevelt Blvd to automate speed enforcement and ticket offenders.
Did Speed Cameras Make Roosevelt Blvd Safer?
Initial reports from the city have shown positive impacts from the speed cameras, with a 90% reduction in excessive speeding, a 36% drop in car crashes, and 50% fewer traffic deaths in the first seven months. [5]
How did speed cameras achieve such a dramatic effect, and will they continue to positively impact crash rates on the boulevard beyond their initial install? Furthermore, will the tactic be as effective in other cities, or along other roadways in Philadelphia’s high-injury network? Finally, are additional safety improvements needed to achieve the city’s Vision Zero goals for the boulevard?
To investigate these questions, we used StreetLight’s Network Performance tool to look back in time at speed conditions before cameras were installed, track the changes in average speeds (as well as rates of speeding) after cameras were installed, and follow up on where speeds are at now, in 2024, to identify where additional safety improvements may still be critical.
Establishing a Baseline
To understand how speed cameras impacted speeds on Roosevelt Blvd, we need to look back at speed conditions prior to their installation in June 2020. Because StreetLight’s Network Performance tool offers five years of comparable data, we can go all the way back in time to March 2019 to establish our baseline.
This timeframe is particularly useful as a baseline, because it allows us to look at typical speed conditions before the COVID pandemic disrupted traffic patterns across the country (we’ll look at how COVID impacted speeds in the next section).
To establish our baseline, we’ve chosen to analyze a typical Tuesday during the peak morning commute hours (8-9 a.m.). (Notably, this section of Roosevelt Blvd is relatively uncongested so even during peak hours, speeds are not tamped down significantly due to traffic.)
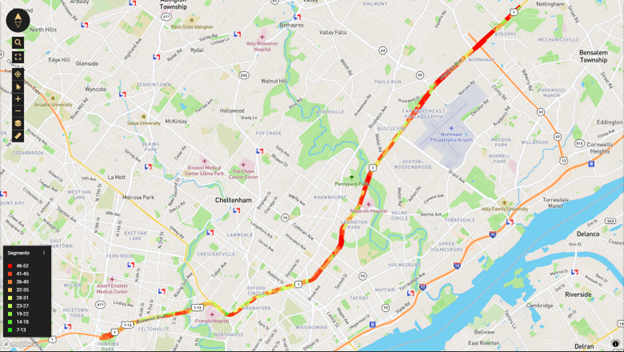
A map of average traffic speeds along Roosevelt Blvd. Higher speeds appear in red, while lower speeds appear in green.
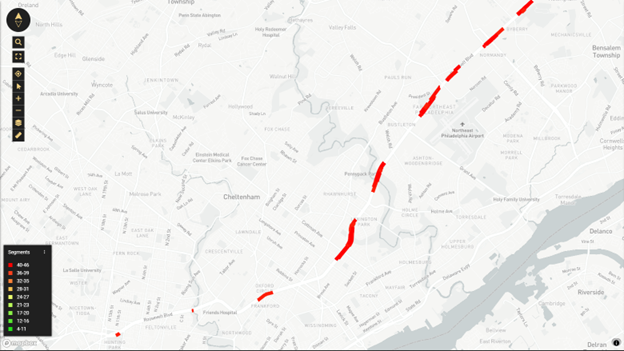
In the map above, we can already see that average speeds exceed the 45 mph speed limit along many segments of the boulevard, and we can see where speeding is at its worst, with segments near Pennypack Park, Northeast Philadelphia Airport, and the Woodhaven Rd (PA-63) interchange standing out.
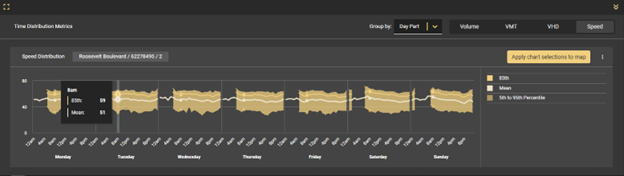
Speed distribution by hour of day and day of week in March 2019 on the Southbound express lane over Pennypack Creek. A beige line marks the mean speed, while the 85th percentile speed is shown with a golden line.
In the image above, we zoom in on a segment of Roosevelt where multiple fatal crashes have occurred — the Southbound express lane over Pennypack Creek. Looking at speed distribution by hour of day reveals that at 8 a.m. on an average Tuesday, the mean speed on this segment is 51 mph. Meanwhile, the 85th percentile speed (i.e. the speed that 85% of vehicles on the corridor are travelling at or below), which is commonly used to estimate rates of speeding, is 59 mph.
Bearing in mind that the posted speed limit is 45 mph along most of the boulevard, these figures reveal that speeding was indeed a significant issue in 2019. And that was before the COVID road safety crisis.
See how dangerous traffic speeds impact walking and biking in your region
It has now been well established that as roads emptied out during the March 2020 stay-at-home orders and subsequent rise in remote work and social distancing, vehicle speeds increased. Unsurprisingly, deadly crashes also spiked. This phenomenon is likely due to the relationship between road capacity and vehicle speed — as capacity increases, drivers tend to take advantage of the extra space to speed up. (This is also why road diets, with their reduction of lane capacity, are considered an effective safety intervention.)
Roosevelt Boulevard was no exception. Looking at the same deadly segment of roadway above Pennypack Creek, we can see that rates of speeding increased above their already high levels.
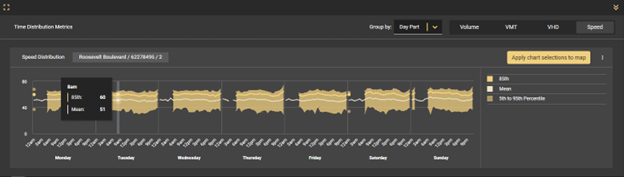
Speed distribution by hour of day and day of week in March 2020 on the Southbound express lane over Pennypack Creek.
During the peak a.m. hours, average speeds remain the same compared to 2019 (51 mph), but the 85th percentile speed has increased slightly to 60 mph. We also observe that speeds tend to spike even higher during non-peak hours, especially during the late evening.
To address this crisis, just a few months later, in June 2020, the City of Philadelphia installed speed cameras along eight particularly deadly stretches of Roosevelt.
Slowing Down: How Cameras Curbed Dangerous Speeding
Looking at average and 85th percentile speeds along Roosevelt Blvd in March 2022, our analysis corroborates the city’s initial reports of reduced speeding.
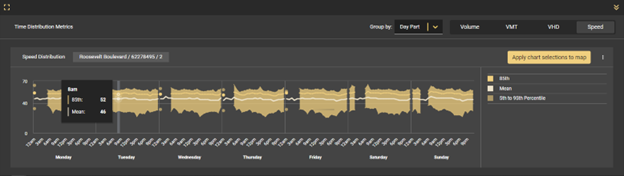
Speed distribution by hour of day and day of week in March 2022 on the Southbound express lane over Pennypack Creek, 21 months after speed cameras were installed.
After over a year of automated speed enforcement from the new cameras, average and 85th percentile speeds on the Southbound express lane over Pennypack Creek dropped significantly. The mean speed of 46 mph nearly matches the 45 mph posted speed limit. Meanwhile, the 85th percentile speed has been reduced to 52 mph – just 1 mph higher than the mean speed two years prior.
Following Up: Did Reduced Speeds Stick?
A look at recent data from March 2024 can help confirm whether the speed reduction observed in 2022 has continued, and where further safety interventions may still be critical to saving lives.
Speed cumulative frequency distribution from 2020 to 2024, highlighting the change in speed profile on the Southbound express lane over Pennypack Creek before and after the installation of speed cameras.
In the graph above, we chart speed distributions from each year analyzed (except 2019, which was identical to 2020 above the 30th percentile). The leftward shift highlights that overall speed continued to drop between 2022 and 2024. As of March 2024, a much larger percentage of vehicles are now traveling at or below the posted speed limit of 45 mph.
So has the boulevard’s speed problem been fixed? While rates of dangerous speeding have significantly dropped — and fatal crash rates along with them, according to city reports — some segments of the corridor may still need further intervention.
Segments of Roosevelt Blvd. with average traffic speed above 40 mph on a typical Tuesday between 8 a.m. and 9 a.m., March 2024.
Using the data trimming tool in StreetLight’s Network Performance product, we can zero in on sections of the boulevard where high-speed traffic still poses significant risk to pedestrians. The map above highlights in red the segments with average vehicle speeds above 40 mph during peak morning hours on an average Tuesday.
Although some of these segments have average vehicle speeds that fall below the 45 mph speed limit, we chose to highlight all segments with average speeds above 40 mph because these speeds fall within the range that is particularly deadly for pedestrians, according to the AAA Foundation.
At least nine highway segments of varying lengths emerge as potential candidates for further safety intervention. As we observed in 2019, segments near Pennypack Park, Northeast Philadelphia Airport, and the Woodhaven Rd (PA-63) interchange are among these high-speed areas.
Insights like these could help city officials determine where to prioritize state grant funds slated for additional traffic calming measures along the boulevard.
Spot Speeds on Roosevelt Boulevard
While the bulk of this analysis examines segment speeds, which are derived from a vehicle’s travel time from one end of a roadway segment to another (and the distance between those points), it can also be useful to examine spot speeds at specific locations along a corridor when evaluating potential safety improvements and the success of past projects.
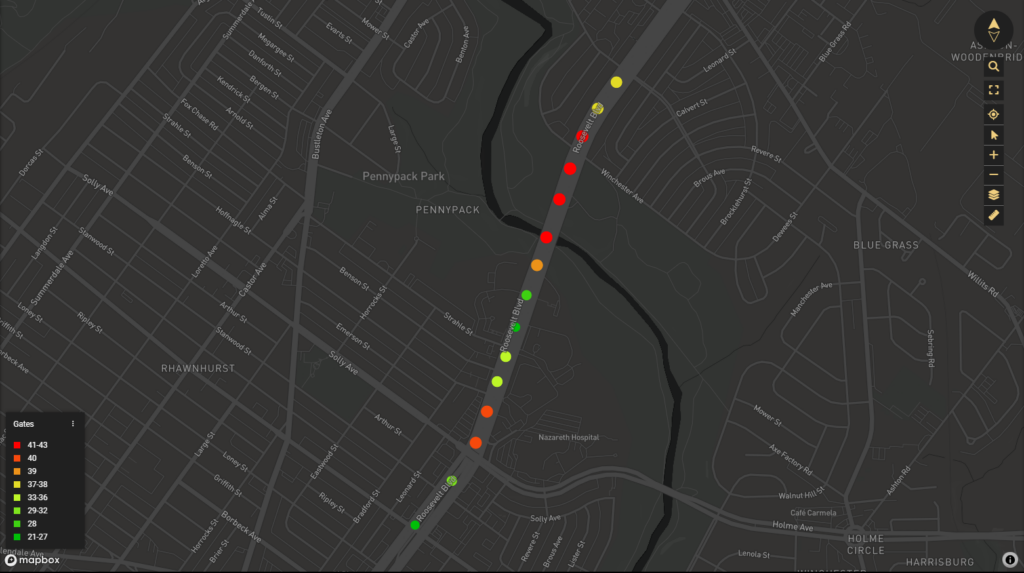
Spot speeds measure a vehicle’s speed at a specific point in time and space, rather than the average speed across a given segment. This means spot speeds are particularly useful when analyzing safety or congestion on smaller roadway segments, such as a single intersection. In our case, they can also help shed light on exactly where drivers slow down and speed up, revealing whether and how quickly drivers speed back up after they’ve passed a speed camera.
In the data viz below, 15 spot speeds taken on a typical Tuesday between 8 and 9 a.m. in March 2024 show vehicles slow down after passing Pennypack Creek as they approach a speed camera located near Strahle Street. Drivers then speed up again as they approach Solly Ave, slowing once more as they approach an intersection with pedestrian crosswalks at Rhawn Street. These granular insights can help cities like Philadelphia determine the most effective safety measures to further the benefits of speed cameras.
Colored dots show spot speeds along Roosevelt Blvd. near Pennypack Creek on a typical Tuesday between 8 a.m. and 9 a.m., March 2024.
More About StreetLight’s Network Performance Tool
StreetLight’s Network Performance tool is ideal for before-and-after analyses like this. It offers five years of data comparability so cities can look back in time to understand how roadway conditions have changed over time, including traffic patterns from before COVID, which are often sought out as a baseline to understand “typical” past conditions. They can also analyze the impact of policy interventions to show the public the efficacy of their work.
Since many roadways lack permanent traffic counters (or only recently had counters installed), this ability to access historical traffic data for any road unlocks before-and-after analyses that would otherwise be impossible.
As we’ve demonstrated in our analysis above, agencies can use this Network Performance tool to proactively identify locations with a trend of excessive speeding, particularly where it overlaps with high crash rates, pedestrian/bicycle activity, or Justice40 communities.
With the data trimming option shown in the section above, agencies can easily pinpoint problematic road segments instead of relying on anecdotal observations about excessive speeding, or worse, waiting for the next crash to identify an unsafe traffic pattern. Likewise, this tool offers agencies the ability to monitor the impacts of changes in land use (e.g., new development), infrastructure (e.g. lane additions), traveler behaviors (e.g. work-from-home patterns due to COVID), traffic calming measures (e.g. speed limit reductions or speed cameras), and more.
The ability to analyze both segments speeds and spot speeds also offers added granularity that can be useful in understanding driver behaviors and diagnosing dangerous locations along a roadway.
Delaware Valley Regional Planning Commission. Crash Statistics for the DVRPC Region. https://www.dvrpc.org/webmaps/crash-data/
CBS News. “Philadelphia’s Roosevelt Blvd. Among most dangerous roads in US” July 10, 2023. https://www.cbsnews.com/philadelphia/video/philadelphias-roosevelt-blvd-among-most-dangerous-roads-in-us/
AAA Foundation for Traffic Safety. “Impact Speed and a Pedestrian’s Risk of Severe Injury or Death.” September 2011.
Michaela Althouse. Philly Voice. “Philadelphia gets $19.3 million for road safety projects from PennDOT, most directed to Roosevelt Boulevard work.” February 3, 2024. https://www.phillyvoice.com/roosevelt-boulevard-traffic-safety-projects-philadelphia-grants-penndot/
Philadelphia Parking Authority. Roosevelt Boulevard Automated Speed Camera Annual Report. April 2023. https://philapark.org/wp-content/uploads/2023-Speed-Camera-Report-Final-32023.pdf
Investigate local traffic trends with a free trial of StreetLight InSight®
Explore the resources listed above and don’t hesitate to reach out if you have any questions. We’re committed to fostering a collaborative community of transportation professionals dedicated to building a better future for our cities and communities.
As concerns around productivity, sustainability, efficiency, and social equity have grown across the U.S., so has the importance of mobility. And though transportation infrastructure has been advanced and codified over centuries under the formal governance of federal and state-level Departments of Transportation (DOTs), Metropolitan Planning Organizations (MPOs), local municipalities, and certain commercial bodies, there is still a long way to go to ensure safe, accessible, and equitable mobility for all.
To make progress, it helps to understand the difference between mobility as a holistic term and transportation as a narrower focus. Mobility is a more comprehensive topic, and moves beyond physical transportation into the whole ecosystem. An analysis of mobility issues may show that some Americans have only limited access to transportation modes, thus limiting their mobility. Some legacy transportation modes only work independently of others and contribute to growing sustainability worries.
This article explores why local authorities and enterprise companies must pay close attention to mobility in transportation. It also suggests ways to take advantage of the tremendous wealth of data that’s now available to help with planning and growth.
We’ll focus on the following areas:
Defining Transportation and Mobility
Why Does Mobility Matter?
What’s the Difference between Mobility on Demand and Mobility as a Service?
Smart Transportation and Mobility
The Data Behind Better Mobility
Defining Transportation and Mobility
Transportation refers to how goods and people move from point to point. It includes elements such as infrastructure, vehicles, fuel, regulation, logistics, and technology. For example, planners need to decide if roads, highways, bridges, and public transit systems have sufficient capacity or efficiency.
Mobility looks beyond the “nuts and bolts” of transportation to assess how systems offer good access and ease of movement to people and things. The distinction may seem subtle, but focusing on how much people have the ability to move helps highlight factors of accessibility and equity.
A transportation system might provide the opportunity for people and things to move from place to place in one way or another, but a person may still be immobile within this system due to factors like disability, poverty, racial profiling and discrimination, or an inability to understand the language of roadway signs or public transit instructions.
Mobility systems help make transportation more efficient, minimize congestion, reduce travel times, and ensure a good flow of people within an area. Good mobility systems also offer a variety of transportation options catering to various needs like walking, cycling or public transport, as well as shared mobility services.
What’s an Example of Good Mobility?
When a community has good mobility solutions, its people have access to various transportation services, some of which cater to the individual needs of those on low income, the elderly, or people with disabilities. When new infrastructure or policy is added to the community, efforts are made to ensure it is equitable and inclusive. This in turn means people can use the transportation network to easily access essential services like recreation, education, healthcare, and employment.
Why Does Mobility Matter?
Mobility issues affect the economy, the environment, safety, and social equity in many ways.
Productivity and the Economy
While transportation networks are built to enable to movement of people and goods, mobility focuses on the factors that impact people and things’ ability to move. Therefore, while the movement of goods via freight, aircraft, and ships is one key way transportation systems impact the economy, a focus on mobility will further highlight the human elements of a well-functioning economy.
We’ve already noted that a good mobility system ensures people can access places of employment, the healthcare that keeps them well enough to work, and education systems that can help prepare them for specialized labor and teach financial literacy. In addition, when mobility systems are efficient, commute times are reduced, delivery drivers arrive quickly, and customers have easy access to goods and services.
Studies confirm that when mobility is compromised, retail businesses suffer. For example, when vehicle and pedestrian traffic dropped during the pandemic, retail vacancies also spiked. As people regained some of their mobility and traffic began to recover, so did retail vacancy rates, though the impact of COVID still lingers in many cities.
Social Equity and Quality of Life
Mobility improves the quality of life within communities, giving access to careers, healthcare, education, and recreation. Likewise, mobility supports social inclusion, giving people convenient access to spaces of shared community, governance, care, culture, and more. Public transportation is a key part of creating convenient, accessible access to these facets of social life, yet 45% of Americans have no access to it. [1]
If people do not have equitable access to transportation modes, this inevitably leads to disparity and social injustice. [2] Planners can consider topics like “spatial mismatch,” where there’s a lack of connectivity between employment centers and communities. They may investigate countermeasures such as reverse commuting, to connect low-income city areas to a suburban job center.
Meanwhile, extreme weather events are in the news, and mobility systems need to become far more resilient in the face of climate change. [3] For example, rising sea levels and extreme storms cause flooding and storm surges, which damage roads and bridges. Over time, this can also weaken roadway materials, leading to higher repair bills and traffic congestion.
Excessive heat could also damage rail tracks and cause cracks to appear in roads, posing safety risks for travelers and transportation workers.
As the climate crisis causes more extreme weather events like wildfires, floods, and landslides, the ability to evacuate also becomes all the more critical to saving lives. Access to safe modes of transportation and evacuation routes with enough capacity to support mass travel out of an affected area can become major factors to survival, as well as the ability to return, recover, and rebuild after disaster strikes.
Congestion and Commuting
The economic cost of congestion is significant, especially in large cities. It can lead to wasted time, energy, and fuel as commute times stretch and people take more time on the way to work. To relieve congestion, transportation agencies might add separate bus or bike lanes, or completely redesign a busy intersection to improve flow. For example, they may convert the intersection into a traffic light-controlled operation or install a roundabout.
Get your Guide to the Transportation Data Revolution
Safety and mobility are intrinsically linked. When people do not have access to safe means of travel, their mobility is dramatically reduced. Vice versa, if someone is not mobile, they will likely lack access to resources that keep them safe.
For example, if someone who relies on public transit to get around does not have a safe pedestrian path that can take them from a bus stop to a healthcare facility, they may be forced to miss doctor’s appointments because they cannot travel without putting themself in danger. Simultaneously, this lack of access to medical care also makes them vulnerable to disease, disability, and death.
The danger people face on U.S. roads mustn’t be understated. Although there was a slight decrease in road fatalities across the US in 2022, these deaths represent a rate of 1.35 fatalities per 100 million vehicle miles traveled.4 In addition, pedestrian fatalities actually increased over this period, even as pedestrian activity plummeted.
Although vehicle safety regulations in the U.S. have improved over the years, they still leave much to be desired, and fail to take into account the safety of those outside vehicles such as cyclists, pedestrians, and road workers. Our Transportation Safety Data Handbook has more information on how transportation professionals can assess road safety and move toward safer infrastructure and operations.
What’s the Difference between Mobility on Demand and Mobility as a Service?
While infrastructure and policy are critical to mobility, recent technological developments also hope to advance urban mobility. Two key developments in this area have been the emergence of mobility-on-demand (MoD) and mobility-as-a-service (MaaS) technologies.
MoD provides on-demand access to a range of transportation systems throughout the community. These could include micro-mobility (small, low speed, electrically-powered transportation options) or ride-sharing solutions such as Lyft or Uber.
On the other hand, MaaS has a more integrated and broader focus involving a range of transportation modes. These might also include ride sharing, but extend to public transit and more, providing an end-to-end and seamless transportation experience for a range of users.
For example, apps can be used to deliver real-time information about public transportation, including train and bus schedules as well as info about ride-sharing options so people can plan their journeys.
MoD and MaaS are part of a larger ecosystem of smart transportation technologies that are advancing mobility, which we’ll explore next.
Smart Transportation and Mobility
Smart transportation solutions help to create more sustainable, efficient, and convenient mobility systems. These solutions rely on cutting-edge technology and connected infrastructure. Efficient services depend on the collection and analysis of data from various sources with the aim of optimizing systems and enhancing mobility. These data sources can include road sensors, mobile apps, GPS, traffic lights, connected vehicles, and more.
Because smart transportation systems often use data from personal devices like smartphones and connected vehicles, strong data privacy practices are key to ensuring positive impact. For example, you can learn how StreetLight anonymizes and validates traffic data here.
For example, smart transportation systems can support mobility by:
Delivering relevant and up-to-date data to help travelers make better or more informed decisions. Travelers might reference public transit schedules and real-time vehicle positioning, traffic conditions, or parking availability. This can improve mobility by reducing travel time and congestion as well as boosting transit ridership.
Creating more seamless integrations between different modes of transportation. For example, smart transportation systems might help travelers plan a route that allows them to bike safely to the nearest bus stop, and which stop to get off so that they can use a protected bike lane to travel the remaining distance. This seamlessness encourages people to rely less on private cars and plan point-to-point journeys through these multi-modal solutions.
Providing transportation professionals with the data they need to adjust traffic signals and optimize daily operations based on real traffic patterns, leading to safer travel with less congestion.
Minimizing human mistakes for safer roadways through collision avoidance systems and other in-vehicle smart tech.
The Data Behind Better Mobility
As noted in the section above, advancing mobility effectively relies on having actionable data about how people and vehicles move, whether they are walking, biking, busing or driving — or even using multiple modes in a single trip. Transportation professionals often rely on automatic traffic counters, manual counts, or surveys to collect this data, but these traditional methods each have limitations.
More and more, transportation planners and engineers are supplementing these traditional methods with online, on-demand traffic data platforms, which use big data methods to deliver more information for more roads and more modes, for any time of the day or year.
For example, in the video below, Xinbo Mi, a Senior Transportation Engineer at Evansville MPO explains how the agency uses big data analytics from StreetLight to understand real traveler patterns, such as the top routes people use to access a major regional hospital, and who is actually using existing infrastructure.
Explore the resources listed above and don’t hesitate to reach out if you have any questions. We’re committed to fostering a collaborative community of transportation professionals dedicated to building a better future for our cities and communities.
In the United States, transportation planning goals and existing road design are often out of sync. In many U.S. cities, roads were built first for vehicles, with little thought given to other types of transportation.
This imbalanced approach has far-reaching effects, impacting public health and well-being in many ways. In 2022, there were over 7,600 pedestrian deaths in the U.S., more than 17% of all traffic-related fatalities. [1] Meanwhile, the transportation sector is responsible for more than 25% of all pollution-related deaths each year. [2] Not only that, but the existing road infrastructure in many cities fails to account for the 9% of U.S. households that don’t have a car [3] or the 45% of Americans who lack access to public transportation. [4]
Solving these problems requires a different approach to transportation. Instead of putting the majority of public and private resources into one mode of transportation (i.e., vehicles), cities can expand multimodal options, investing in infrastructure that supports a wide range of transportation modes, from public transit to pedestrian traffic. By shifting to multimodal transportation, we can make our roadways safer and more accessible for all — and move the needle in the fight against climate change.In this post, we’ll cover:
Multimodal transportation definition
Multimodal vs. intermodal transportation
Benefits of multimodal transportation systems
Building complete streets
Understanding multimodal movement through data
What Is Multimodal Transportation?
In one sense, the definition of multimodal transportation is straightforward: It’s an approach to transport that incorporates all modes people use to get around. These may include:
Automobiles
Commuter railways
Buses
Bicycles
Walking
Micromobility modes such as e-bikes and scooters
A fully multimodal transportation system features not only roadways that can support a variety of transport methods, but also a well-integrated public transit system. In other words, the entire mobility infrastructure must be designed to support a variety of ways for people to get around, along with easy commuter access to public transit and ease of transition between modes.
For example, when placed near every bus stop or subway access point, sidewalks and crosswalks can enhance safety and accessibility for cyclists and pedestrians. Public transit can also be designed to allow for easy transportation of bikes, and transit stations equipped with benches and shelter. Many American cities lack these infrastructural features, instead featuring mostly multilane roads without bike lanes, few crosswalks, open-air transit stops, and lots of land dedicated to vehicle parking lots.
Bus riders with skateboards wait at a bus stop, combining multiple modes of transportation in one trip.
Multimodal vs. Intermodal Transportation
A fully multimodal system is also intermodal, meaning that it facilitates a seamless flow of commuters across the various methods of transit. It also prioritizes pedestrians and other non-vehicle commuters in a way our current systems often do not.
For instance, if someone wants to visit the grocery store or the barber, intermodal design makes it possible for that person to safely choose non-vehicle options for getting there, such as walking or biking. If the trip is far, it might also ensure that person can easily bike to the nearest bus stop, bring their bike onto the bus, and then safely disembark and securely park their bike at their destination.
In a city that prioritizes intermodal design, a commuter can easily look up public transit stops and schedules online or on a mobile app. They can even find available e-bikes in the same app and plan their route accordingly. In one fluid process, they can walk to the e-bike, rent it, ride to the bus stop, wait in shelter and safety, and get to their destination on time, regardless of where they live or their socioeconomic status. True multi- and intermodal transportation systems dissolve the boundaries between different modes of travel.
While this vision is far from realized in any American city today, there are encouraging signs of transformation. While denser cities like New York and Chicago are frequently cited, Memphis also offers a promising model for more typical American cities. Memphis city planning agencies have invested heavily in multimodal transportation, such as bike paths, carpool lanes, trolleys and even water taxis. [5] These investments have also positioned Memphis as one of America’s leading cities for freight and logistics operations. [6]
The Benefits of Multimodal Transportation Systems
Transitioning to a multimodal transportation system brings a wide range of advantages, but we can summarize them in terms of their equity, environmental, and economic benefits.
How Multimodal Transport Is More Equitable
Multimodal transportation is more equitable than a single-mode system, both in terms of transportation access and public health.
As noted above, roughly 9% of American households have no access to a vehicle. However, that lack of access is skewed heavily toward minority communities. A full 18% of Black households lack vehicle access, for example, while the same can only be said for 6% of White households. [3] Many minority communities also find it harder to access efficient means of public transportation. In some cities, Black commuters take 25% longer than White commuters to reach their workplace destination. [7]
These inequities extend beyond race and class and also cut across age lines. One AARP study revealed that 48% of Americans over age 50 don’t have a comfortable place to wait for the bus, while 47% can’t access crosswalks to cross main roads safely. [8]
The effects of such inequities are multifaceted, but perhaps none illustrates the disparity more than health outcomes. Pollution from transportation has an outsized impact on low-income communities, minorities, and young children. [9] Meanwhile, access to active forms of transportation like biking and walking has been correlated with increased physical activity, resulting in a 12% decrease in mortality and an 11% drop in cardiovascular disease. [10] Finally, deaths involving vehicles disproportionately affect pedestrians, children, older adults, and Black Americans. [11], [12]
Poor air quality from pollution results in 100,000–200,000 annual deaths in the U.S. [13] However, the transportation sector’s effects on air quality extend beyond immediate public health concerns to threaten the environment as a whole. Currently, transportation accounts for 29% of all greenhouse gas (GHG) emissions in the U.S., more than any other sector. [14]
On a global scale, the United Nations has set a target of a 50% reduction in transportation-related carbon dioxide emissions by 2050, citing this as a critical target to help reach larger goals for mitigating climate change. [15] While many of these initiatives focus on the transition to electric vehicles — and they should — there is also a case to be made for a broader focus on multimodal transportation.
For instance, one study showed that cyclists produced 84% fewer greenhouse gas emissions than those who used cars or public forms of transit. [16] Making cycling, walking, and e-mobility more accessible and safe could have a substantial effect on GHG emissions. Even moving more Americans from cars to public transit would go a long way.
How Multimodal Transport Boosts Economic Prospects
It’s no secret that automobiles are expensive. Depreciation, maintenance, and rising fuel expenses are all costs of ownership, and the purchase price of vehicles has risen steadily in recent years. [17] On top of that, today’s high interest rates make financing a car an even more costly proposition.
One of the simplest solutions to this cost burden is to make cars less of a necessity. When more Americans can choose alternative forms of transportation, they can allocate less of their budget toward getting around. For instance, shifting from vehicle to public transportation would save the average American $13,000 a year, according to the American Public Transportation Association. [18]
However, a multimodal system does more than simply reduce expenses — it also creates an onramp for upward economic mobility. Studies have shown a strong correlation between shorter commute times and economic mobility. [19] Yet, many high-paying jobs or better opportunities remain out of reach for low-income and minority communities, simply because the commute is too long and costly. By expanding access to efficient and affordable public transport, adding more forms of micromobility, and making transit stops easier to reach by bike, multimodal systems can help to bring these jobs within reach.
This impact extends beyond individual citizens to impact the local economy as a whole. Although more research is needed to secure concrete data, numerous studies have shown positive impacts on local business revenues when cities invest in making their roads more pedestrian- and bike-friendly. [20]
Building Complete Streets
Ultimately, to advocate for multimodal transportation is also to advocate for what are known as “Complete Streets.” Although true multimodal logistics and planning must account for more than just street design, no multimodal system is sufficient without considering this critical component.
A Complete Streets approach considers accessibility and safety from every angle when it comes to street layout. From adding bike and bus lanes to upgrading traffic signals for the visually impaired, Complete Streets policies aim to make roadways safe and user-friendly for everyone.
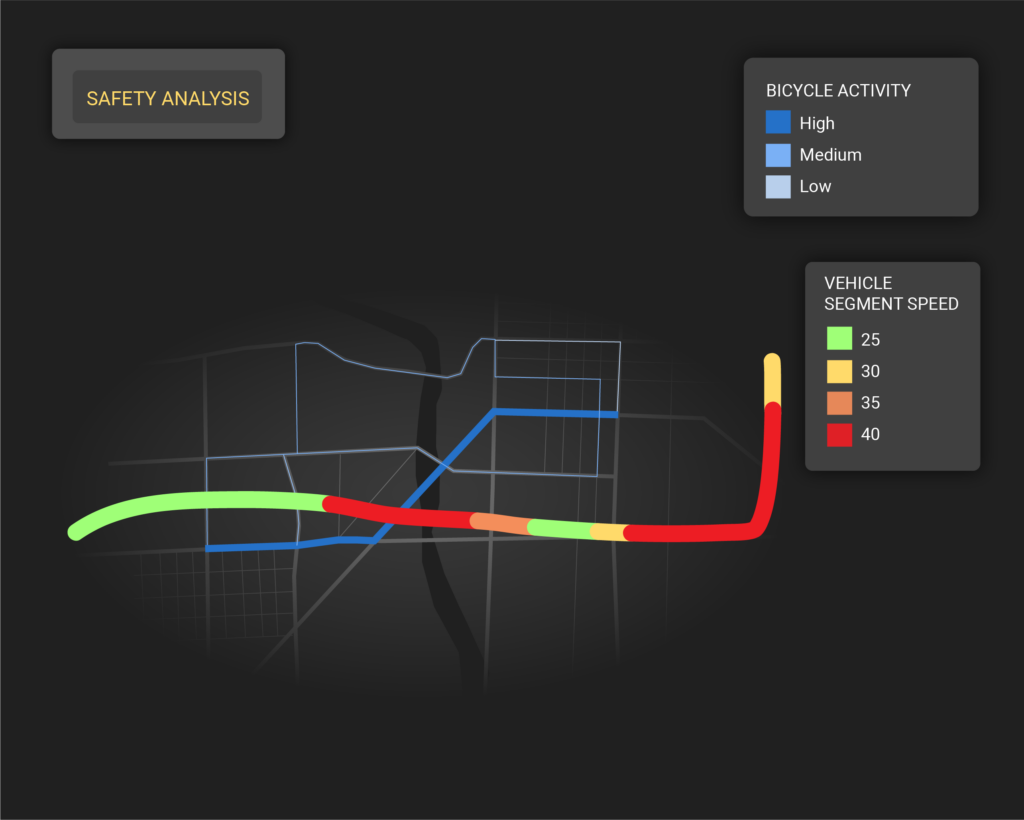
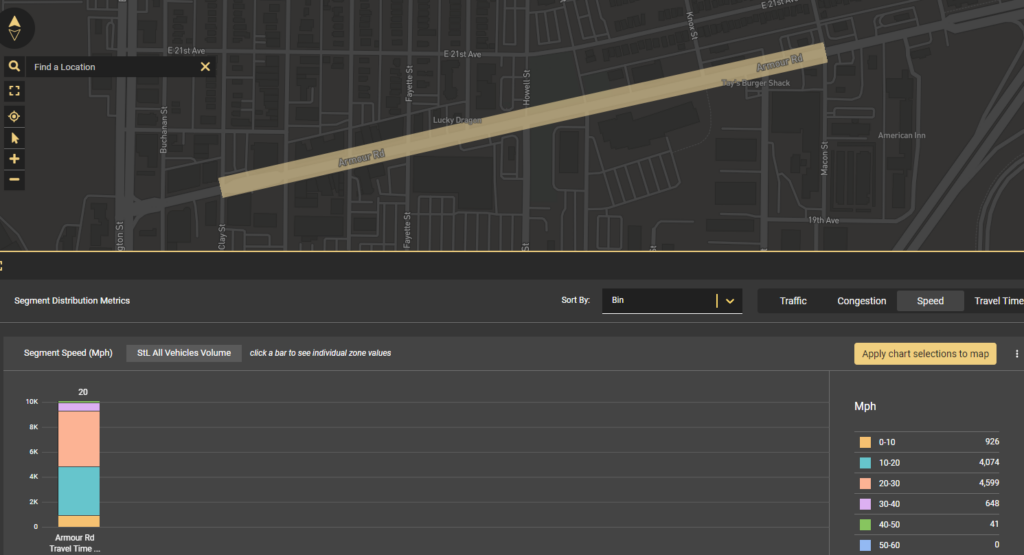
Designing Complete Streets has been shown to slow down traffic even without substantially increasing congestion. For instance, one StreetLight study of a bike lane installation in North Kansas City, Missouri, showed that the bike lanes nearly eliminated traffic traveling over 40 miles an hour while only increasing the average vehicle trip by five seconds.
A visualization from StreetLight InSight® of average speed on Armour Road in the 2021 study period shows how the bike lane curtailed speeding. There are very few instances of vehicles traveling above 40 mph (shown in green) when that proportion was much higher before, about one in every 20 trips.
Understanding Multimodal Movement Through Data
Effectively implementing a multimodal transportation plan always begins with understanding the current traffic patterns and modes of transportation in your area — and data access is essential for that understanding. What percentage of people use vehicles as opposed to public transit, cycling and walking? How many of the cars on the road are electric? Where is public transit readily accessible? Data offers answers to these important questions.
For example, when a Vancouver transit agency, TransLink, needed to gain political buy-in for investments in multimodal infrastructure, they combined StreetLight’s vehicle volumes data with their own ridership counts to show that bus usage was much higher than previously understood, helping them make the case for new bus lanes and rapid bus lines.
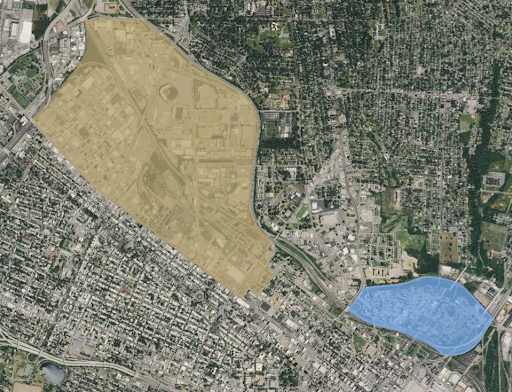
Transportation data can also help evaluate existing multimodal infrastructure for equitable impact. For instance, in the video below, Alex Bell of Renaissance Planning explains how they used StreetLight’s multimodal metrics to help Richmond, VA develop measures of accessibility for walking, biking, and transit modes. This data allowed them to reveal the causes and impacts of low access, including who is most underserved by existing infrastructure.
Governors Highway Safety Association. “Pedestrian Traffic Fatalities by State.”
Environmental Science and Technology Letters. “Reducing Mortality from Air Pollution in the United States by Targeting Specific Emission Sources.”
National Equity Atlas. “Car access: Everyone needs reliable transportation access and in most American communities that means a car.”
American Public Transportation Association. “Public Transportation Facts.”
Explore the resources listed above and don’t hesitate to reach out if you have any questions. We’re committed to fostering a collaborative community of transportation professionals dedicated to building a better future for our cities and communities.
What Are Complete Streets and How Can Analytics Help Us Build Them?
What Are Complete Streets and How Can Analytics Help Us Build Them?
Focusing on car-centric infrastructure can compromise roadway safety, increase emissions, and leave many without a reliable way to get from A to B. But Complete Streets policies promote safe and equitable outcomes for all road users.
We have a tendency, particularly in the U.S., to design roads for cars and trucks. Decades of vehicle-centric city planning have exacerbated this tendency, as sprawling metropolises make travel by car essential for most Americans.
This focus on car-based travel leaves many people behind. Pedestrians and cyclists face unsafe roadways without bike lanes, sidewalks, or crossings. Those who cannot drive or afford a car struggle to get to work via transit or access essential resources like grocery stores and doctors. People living near congested highways — predominantly communities of color [1] — suffer the effects of both noise and air pollution, impacting health outcomes.
In the face of these realities, we need a paradigm shift in how we design streets. Instead of vehicle-first transportation systems, we need people-first transportation systems. And this new paradigm is already gaining ground through programs like Complete Streets.
What are Complete Streets?
“Complete Streets” is an approach to roadway policy and design that focuses on enabling safe mobility for all road users — drivers, pedestrians, bikers, and public transit riders alike, across the full spectrum of ages and abilities. [2]
For example, a Complete Streets policy may call for the implementation of pedestrian traffic signals that are accessible to those with visual impairments. Policies may also call for added bike lanes and bus lanes to improve safety and access to these transportation modes, or the implementation of curb extensions, crosswalks, and daylighting to provide safer paths for pedestrians.
Many public officials at the local, regional, state, and federal levels are working to build better bicycle, pedestrian, and transit infrastructure through Complete Streets policies. The concept of Complete Streets is now mainstream in transportation, with planners striving to design and build streets that safely accommodate all transportation modes and users. In fact, according to the National Complete Streets Coalition, over 1,700 Complete Streets policies have been passed in the U.S., including those adopted by 37 states, Puerto Rico, and Washington D.C.
In this article, we’ll discuss several benefits to Complete Streets and how we can leverage transportation analytics to build more of them.
Why are Complete Streets more equitable?
Streets with multimode infrastructure offer more ways to travel, increasing mobility for everyone. Whether they drive, bike, walk, or use public transit, Complete Streets give them ways to get from point A to point B. This is especially crucial when point B is an essential resource like food, healthcare, work, or school.
Vulnerable populations, including people of color, people with disabilities, and those who are impoverished or experiencing homelessness are less likely to own or drive a car. Ensuring that non-car travel options exist increases access to mobility for these groups while also benefiting other travelers.
It’s important to note that the existence of non-car travel options doesn’t always ensure the accessibility of these options. Here, we mean accessibility in multiple senses — accessible for people with disabilities and accessible more broadly for all road users. Even when non-car mode options exist, there can be barriers to their use such as inadequate seating at bus stops or English-only signage.
In the video below, Alex Bell of Renaissance Planning explains how he used multimode analytics from StreetLight to compare mode availability to mode utilization in order to diagnose barriers to access for vulnerable populations.
Access to non-car transportation options can also help ensure fewer people suffer from homelessness. According to Jacob Wasserman, a researcher at UCLA who conducted a meta-analysis on transportation and homelessness,
“Homelessness is first and foremost a housing problem, but transportation is so intimately tied into housing. People can only live in places they can afford, which is sometimes really far from [the things they need to reach] because of our transportation decisions.” [3]
And because Complete Streets allow more opportunities for non-car travel, they also reduce overall Vehicle Miles Traveled (VMT), leading to improved air quality and less noise pollution for people living near highways, a group made up disproportionately of communities of color. That brings us to the next question….
Why are Complete Streets more climate-friendly?
Transportation is the top source of greenhouse gas (GHG) emissions in the U.S., at 27% in 2020, according to the EPA. That means the transportation industry has a critical role to play in addressing climate change.
Because Complete Streets reduce our reliance on single-occupancy vehicle (SOV) trips by making it easier to use shared mobility and active transportation options, they also lower total Vehicle Miles Traveled (VMT). By reducing the number of cars on the road, Complete Streets also help reduce traffic congestion, which means less time stuck in traffic with the engine running. With fewer miles traveled and less time spent in cars, emissions drop and air quality improves.
Adding Complete Streets infrastructure to existing roads can also have the effect of calming traffic. For example, road diets — which reduce the number of vehicle lanes and often repurpose the space for multimodal infrastructure — tend to reduce vehicle travel speeds and vehicle throughput without causing the congestion that would lead to increased emissions. Since vehicles are less fuel efficient and emit more CO2 per mile traveled at higher speeds, this means multimodal Complete Streets infrastructure can sometimes double as traffic calming measures that reduce emissions while also improving safety.
In the example below, AEC firm ATCS identified opportunities to invest in multimodal infrastructure on Route 234 Business in Prince William County, Virginia with the goals of reducing congestion, increasing safety, and making travel more sustainable.
Creating these opportunities for mode shift is crucial to decarbonizing our transportation networks, although they are just one strategy we can use to reduce overall emissions. We explore additional strategies in our free guidebook, Measure & Mitigate: Transportation Climate Data Solutions.
Why are Complete Streets safer?
As roads emptied and travel speeds increased during COVID, severe crashes spiked. This made many cities less safe for bikers and pedestrians in particular, highlighting the urgency of infrastructure improvements and traffic calming measures to make streets safer.
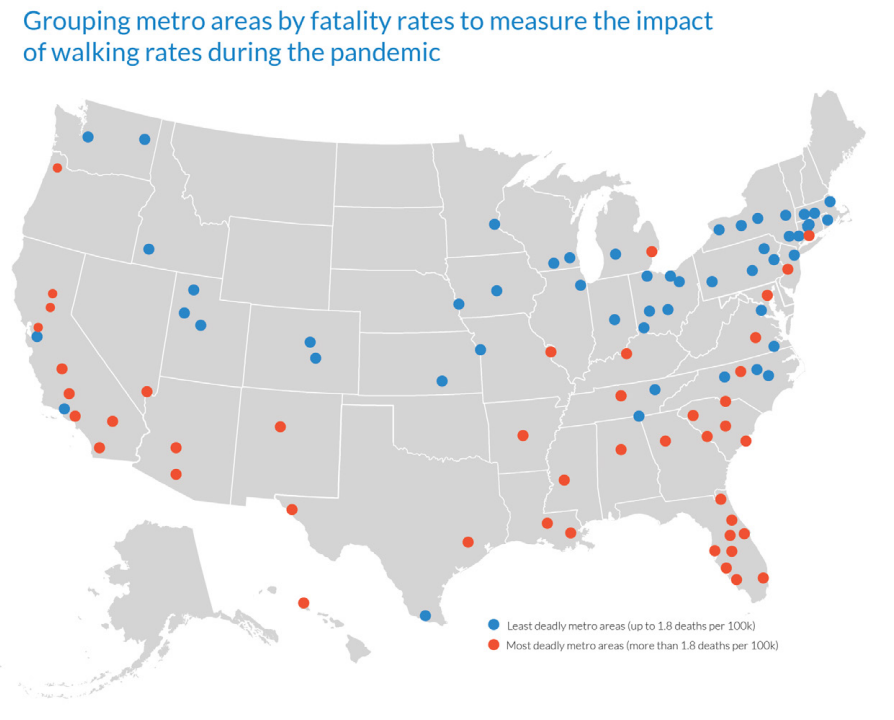
Smart Growth America’s map of most deadly vs. least deadly metro areas for pedestrians.
When streets lack multimodal infrastructure like signalized crossings and bike lanes, that doesn’t prevent non-car road users from needing to travel. Many still need to walk, bike, or use public transportation in order to access basic necessities, forcing them to brave streets that lack the infrastructure needed to keep them safe as they travel.
Adding accessible sidewalks, crossings, bike lanes, bus lanes, signage, and other Complete Streets infrastructure helps ensure that not only can people travel, but they can do so safely.
Complete Streets improvements may also mean making streets safer not just for travelers, but also for road workers, outdoor patio diners, and homeless people sheltering under overpasses or asking for help at intersections. In the example below, the City of Pasadena implemented various traffic signal timing techniques to reduce the speed on corridors with outdoor dining, as well as other arterials.
For more strategies to make streets safer, download our free Safety Handbook.
How can we build more Complete Streets?
With all these benefits to Complete Streets, how can transportation professionals make headway on ensuring more of our streets serve all road users?
Implementing official Complete Streets policies can provide the incentive and accountability to get started. In the U.S., the Federal Highway Administration (FHWA) offers guidance for transportation agencies looking to establish Complete Streets policies. [4]
The Federal Transit Administration has also waived the local funding match requirement for Complete Streets planning activities to receive funding through the federal State Planning and Research Program (SPRP) and Metropolitan Planning Program (MPP) through the end of 2026.
Because so many factors might go into making streets “complete,” — bike lanes, bus stops, signage, sidewalks, well-timed traffic signals, and so much more — understanding existing roadway conditions, mode usage, traveler demographics, and the impact of past projects are key. This is where digital transportation analytics come in to help agencies identify high-priority improvements and develop data-supported implementation plans.
StreetLight InSight® allows users to compare bike activity to trip speed info to pinpoint where bikers may face dangerous road conditions.
Transportation analytics for Complete Streets
The right data is necessary to identify and prioritize high-impact roadway improvements, secure project funding, and earn public and political buy-in for your proposed solutions. While traditional data collection methods like sensors and surveys offer helpful data points to support these goals, they often present limitations in scope and sample size. Digital, on-demand transportation analytics fill in the gaps to enrich our understanding of travel patterns and the needs of road users.
Because installing new multimodal infrastructure can be costly and time-consuming, one of the easiest ways to make streets more complete is to evaluate the performance of existing infrastructure and identify opportunities for optimization.
Say you wanted to optimize bus schedules or add stops to an existing route to adapt to shifting travel demand. An Origin-Destination (O-D) analysis using digital traffic data can illuminate where lots of people are traveling between work and home, while the ability to view traffic volumes by time of day can help determine when most people need to travel. Aggregated demographic data can also be overlaid onto travel patterns to understand where vulnerable populations would most benefit from added stops.
For example, when commuting patterns shifted after COVID, bus ridership in San Francisco dropped disproportionately to other modes. On-demand transit metrics helped SamTrans understand shifting travel behaviors and boost bus ridership by 30% after adjusting bus schedules.
When installing new infrastructure such as a bike lane or pedestrian bridge, digital analytics help agencies prioritize high-impact locations to invest in multimode infrastructure. For example, one Parks & Rec group used O-D analysis to determine the daily number of bikeable trips (five miles or shorter) to a target destination, justifying their investment in a new trail and bridge facility.
Similarly ATCS used digital transportation analytics to develop a multimodal scoring system for DC DOT that would help them pinpoint infrastructure gaps and determine where new projects were most needed:
Want to learn more about how digital transportation analytics can power effective Complete Streets initiatives? See how on-demand traffic data supports:
Yoo Min Park and Mei-Po Kwan, “Understanding Racial Disparities in Exposure to Traffic-Related Air Pollution: Considering the Spatiotemporal Dynamics of Population Distribution.” Int J Inviron Res Public Health 17 (Feb 2020): 908.
U.S. DOT, “Complete Streets,” August 2015.
Kea Wilson, Streetsblog USA. “Three Ways DOTs Can Help the Unhoused – On and Off the Road.” February 23, 2023.
Federal Highway Administration (FHWA), “Make Complete Streets the Default Approach.” February 2023.
Make streets safer with data-informed infrastructure planning
Explore the resources listed above and don’t hesitate to reach out if you have any questions. We’re committed to fostering a collaborative community of transportation professionals dedicated to building a better future for our cities and communities.
EVs, Decarbonization, & Equity Are Front-and-Center At TRB 2023
EVs, Decarbonization, & Equity Are Front-and-Center At TRB 2023
This year’s Transportation Research Board (TRB) was the first gathering since funds began rolling out in earnest from the Bipartisan Infrastructure Law (BIL). With the pandemic disruption to travel patterns and BIL funding in the background, conference attendees and panel sessions kept coming back to key themes throughout the conference — decarbonization and equity.
As Secretary Buttigieg said in his keynote address,
“Research and innovation will play an exceptionally important role in the decade ahead for transportation.”
But he and others were quick to acknowledge that the challenges transportation professionals faced were in many ways bigger than ever.
While panels and posters covered myriad topics, key themes emerged that will shape the year ahead in transportation planning and research.
We dive into the big topics in our TRB recap webinar. Watch it here.
It’s not about getting people from A to B as fast as possible anymore
It’s hard to say when it happened but there is no question that the transportation industry’s role has expanded. Questions of land use, economic development, safety, resilience, and climate impact all intersect with the transportation industry and must now be considered in tandem with any planning decisions.
As such the way we study our roadways and corridors is completely different from how it used to be — it’s no longer about counting cars at intersections during rush hour. Now we need to take an expansive look at the comprehensive uses and needs of the people using our networks. Even studying who is not using these roadways and why — raising questions of equity and segregation — are central to transportation decisions.
On the one hand, the data available to enact this work has never been more plentiful. But it also requires coming to thorny transportation questions with a set of hypotheses, and being willing to challenge those hypotheses with empirical evidence.
Transportation planners no longer have to work based on a set of assumptions about when people travel and why. Nor could they, given the way the pandemic has utterly disrupted travel patterns. But this also means that they are faced with many ways of looking at a problem. Significant analytical skills will be needed, and even a dose of humility, to ensure that agencies are identifying the biggest problem and then right-sizing the solution to that problem.
Decarbonization is not a buzz word
The centrality of decarbonization was threaded throughout much of TRB. We’ve heard it many times by now — transportation is the single biggest contributor to greenhouse gas emissions. Now BIL funding has put EVs front-and-center as the lever that could help pull transportation emissions downward by putting significant resources behind charger installation. In addition, more incentives for EV purchases could further speed adoption.
To that end, StreetLight’s introduction of EV mode at the conference can help agencies learn and adapt to how EV driver behavior may differ from gas-powered driver behavior, whether current EV chargers are being installed where they’re needed, and whether there are gaps in how roadway networks support EV drivers.
Transportation professionals have other means of pursuing decarbonization beyond facilitating the EV transition, especially by investing in multimodal infrastructure. Here the subject of coordination across local and regional agencies came up often — and remembering that safety, in all its forms, is the most important responsibility of transportation agencies — not speed.
Equity must be threaded into every aspect of transportation
From procurement to infrastructure investment, equity is not a second order function for transportation professionals. As agencies look to unlock infrastructure funding, it’s clear that the equity impact will be central to the success of grant applicants. Data will be essential to making that case for how investments support equity goals, or redress long-standing disparities.
Agencies are tasked with “gathering the data to make the case on ways for transportation policy to be a powerful tool in the service of fairness and equity,” said Secretary Buttigieg.
How the Reconnecting Communities Pilot Program Supports Transportation Equity
How the Reconnecting Communities Pilot Program Supports Transportation Equity
The Reconnecting Communities Pilot Program introduced by the Bipartisan Infrastructure Law (BIL) puts a long overdue spotlight on transportation equity — by addressing the negative impact of existing infrastructure.
As transportation experts, we like to think that new infrastructure improves lives. But as history has all too often shown, without a holistic understanding of transportation infrastructure’s impact, projects can sometimes do more harm than good — especially when they reinforce or create social inequities.
That’s why the Bipartisan Infrastructure Law (BIL) specifically established the Reconnecting Communities Pilot Program, which sets aside up to $1 billion in grant funding over 5 years for transportation projects aimed at redressing the impact of prior infrastructure decisions that left populations segregated and disconnected from local resources.
To ensure that Reconnecting Communities Pilot (RCP) grant funding goes to projects that align with this goal, grant administrators will be looking for evidence that proposed projects will close connectivity gaps and positively impact disadvantaged communities. That means grant applicants will need to pair comprehensive multimodal transportation Metrics on how people travel with demographic insights in order to quantify the impact of their projects on disconnected communities.
Planning and Capital Construction grant proposals for the 2022 fiscal year are due by October 13th but it’s not too late to put together a compelling application.
Our Guide to Building a Data-Driven Reconnecting Communities Pilot Application shows how demographics tied to multimodal insights can uplevel grant proposals and examples in Miami and Baltimore of how StreetLight’s Metrics can help quantify connectivity gaps for Planning and Capital Construction grants.
Working On Purpose: Using Big Data to Make Progress on Transportation Equity
Working On Purpose: Using Big Data to Make Progress on Transportation Equity
Victoria Fanibi joined StreetLight in July 2021, following several years working in community development research at the Urban Land Institute, Catalytic Communities and Smart Growth America.
As a recent StreetLight hire with a background in community development research, equity has been a major focus for me professionally. Joining StreetLight was my formal introduction to the world of Big Data and its applications, and while I was once skeptical about the tech world’s motives and ability to drive positive change, my first few months at StreetLight renew my optimism. It turns out my colleagues here, from StreetLight’s founders to data scientists, had set out to “use data for good” a decade ago and continue to work on purpose to drive positive change.
Despite a shift in my career path from research to software, I am still deeply committed to social equity and sustainable, climate-resilient development. It turns out that StreetLight’s Metrics are invaluable in helping communities address public health concerns, providing necessary insight into the movement of marginalized communities, and promoting progressive mobility solutions.
Equity in transportation is bolstered by a fundamental understanding of how marginalized populations interact with existing infrastructure. In the case of StreetLight’s work with DKS Associates, StreetLight directly influenced equitable outcomes in Lane County, Oregon. Below I share the tenets of this work, followed by two more examples of my employer StreetLight working “on purpose.”
1. Using Big Data to Uncover the Travel Behavior of Title VI Populations
In partnership with DKS Associates, a transportation and planning firm, StreetLight’s Metrics were deployed to conduct equity analyses to support the generation of the Central Lane Regional Transportation Plan in Lane County, Oregon. DKS and StreetLight assessed census tracts with higher-than-average concentrations of Title VI communities of concern to visualize their unique travel patterns.
StreetLight’s main role on this project was to assess the patterns of movement for a sample population in Lane County. Specifically, StreetLight visualized the distances traveled during peak hour trips in the morning and evening between census tracts. The results of this analysis revealed major disparities in travel time and distance: census tracts with higher percentages of communities of concern take longer trips in the morning.
StreetLight’s Metrics provided an invaluable assessment that DKS Associates and Lane County were otherwise incapable of compiling themselves. Had StreetLight Metrics not identified this inequity, Lane County likely would have, unintentionally, exacerbated the existing economic and social disparities of the census tracts. Lane County is now able to move forward in improving connectivity for the whole of the county.
2. Empowering municipalities to address public health issues
The Ohio Department of Transportation relied on StreetLight’s Metrics to study the link between transportation and one of the state’s most pressing public health concerns: infant mortality. With a rate of 7.4 infant deaths per 1,000 live births, compared to the U.S. average of 5.9 deaths, healthcare access is vital for low-income communities in Ohio. The South Linden neighborhood in Columbus is a statistical oddity. South Linden has more single-mother households than 99% of U.S. neighborhoods. Residents of South Linden have a median household income of approximately $21,000 resulting in low rates of car-ownership and dependency on public transit. Despite the remarkable concentration of single mothers in South Linden, there is no neighborhood OBGYN, forcing expecting mothers to travel great distances to receive the necessary prenatal care. The simple act of providing safe, reliable transportation the doctor’s office can drastically increase the health outcomes of low-income pregnancies in Columbus.
Paired with a $50 million federal grant from the Department of Transportation to help create a new transportation system that would specifically address accessibility issues in low-income neighborhoods, Ohio DOT used its Regional Subscription to StreetLight Insight® create actionable transportation analytics from archival location data.
StreetLight Insight® is a cloud-based tool that provides decision-makers, such as transportation planners, the data necessary to advocate on behalf of marginalized communities. In the specific instance of South Linden in Columbus, StreetLight was used to analyze origin-destination metrics to and from clinics, hospitals, and other health offices to tailor transportation investments in low-income communities. StreetLight makes data-informed story telling possible.
3. Supporting the future of mobility
I conclude with the SunPedal Ride as this was my first true encounter with StreetLight’s core values. Within the first month of joining StreetLight, I was invited to meet Sushil Reddy, the founder of the SunPedal Ride and a Guinness World Record holder for solar biking across India, whose ride was co-sponsored by StreetLight. Sushil made his way across the United States on a (mostly) solar-powered electric bike called The SunPedal. The SunPedal Ride, founded in 2016 by Sushil, is an outreach project to ignite conversations about clean, sustainable mobility through a series of endurance journeys on zero tail-pipe emission vehicles.
On August 22, 2021 StreetLight’s Victoria Fanibi, Thomas Grogan and Jeff Peel met Sushil Reddy and Luis Fourzan of the SunPedal Ride team in Washington D.C.
When I met Sushil, we discussed his long-term goals, the mechanics of the SunPedal bike, and the potential social impact of his cross-country bike rides. Through this conversation it became evident that while data companies can default to a mindset where the applications of their data are severed from the values of the company, StreetLight has opted to do the opposite.
Sushil feels an urgency to combat climate change by adopting more sustainable means of living and moving. StreetLight’s sponsorship of SunPedal ride is at once an endorsement of Sushil’s journey across the United States as well as a pledge to continue its support of initiatives that seek to offer real solutions to pressing sustainability and mobility needs.
“I believe that the impact StreetLight has made since 2011 is just a sampling of what is possible. At more than 10,000 smart projects every month, StreetLight’s real-world opportunities seem endless. Perhaps a bold claim, but StreetLight’s Metrics are a lifeline to changing the future of mobility and improving the lives of thousands along the way.”
Transit Equity for Essential Trips: Lessons From Richmond
Transit Equity for Essential Trips: Lessons From Richmond
We’ve learned a lot about America’s more than 50 million essential workers during the COVID-19 pandemic, but we still know very little about their travel needs. This gap is critical to bridge if we are to help these employees get to work and support rebuilding our faltering economy.
In many cities, transit availability is greatly reduced because of lockdown restrictions, social distancing requirements, and growing budget issues. But limiting transit access poses serious equity concerns for access to work, medical services, and other important amenities.
How can cities optimize mobility — via transit and other options — for essential workers? We turned to Big Data to learn more.
Which Communities Don’t Have Access to Cars?
We know essential workers are often socially or economically disadvantaged. A recent study found essential workers, on average, make less than non-essential workers. With a median hourly wage of just $13.12, essential workers in the food and agriculture industry earn the least. Nearly 70% of essential workers do not have a college degree.
We wanted to learn more about how transit systems serve disadvantaged residents, and we decided to analyze Richmond, Virginia during the state’s first lockdown from April 1st to May 31st.
To understand which communities in Richmond depend on public transit the most, we identified the Census block groups with the highest percentage of households without access to a vehicle.
Block groups are important for transportation planning since they are typically small enough to measure pedestrian access to transit. Most of our block groups that lack access to vehicles are located in East Richmond.
Figure 1: Richmond block groups with a high percentage of households without access to a vehicle (Source: U.S. Census American Community Survey).
Where, When, and Why Are These Communities Travelling?
At StreetLight, we use Origin-Destination (O-D) analyses to study travel patterns between origins and destinations for vehicles, trucks, bikes, and pedestrians. For this study, we used an O-D analysis to identify:
Most common destinations for each block group
Time of day distribution of trips
Difference between weekend and weekday travel patterns
Figure 2: Citywide Origin-Destination analysis for block groups with highest percentage of residents without access to a vehicle. Origin zones are in blue and destination zones are in yellow.
The O-D analysis helped us visualize Richmond’s travel patterns on a neighborhood scale. One neighborhood in particular emerged — Gilpin Court is one of the top block groups without vehicle access, and is also relatively isolated due to bisecting and surrounding highways. This area was recently profiled in the New York Times as an historically redlined neighborhood.
We analyzed typical weekdays in April and May 2020 to understand the top destinations for trips starting in this neighborhood. The top destination for the Gilpin Court neighborhood is a block group where two essential businesses are located: a grocery store and a hardware store (see Figure 3). There are also multiple corner markets located in Gilpin Court, but this is the closest full-service grocery store to the community.
Figure 3: The top destination for Gilpin Court (in blue) is a cluster of block groups (in yellow) with essential businesses including a grocery and hardware store.
While they may look close, the block groups are about 1.5 miles away (an estimated 30-minute walk or five-minute drive). The highways also limit mobility by making walking and biking difficult. This distance would be especially difficult if a person is carrying a week’s worth of groceries.
Current transit service through Gilpin Court runs north-south. Looking at the top destinations for trips originating in Gilpin Court we see that many of these trips are covered by the north-south service. There are multiple overlapping transit routes in this area that provide 15-minute frequency of transit service throughout most service hours. However, transferring to another route is required to reach these essential businesses. This not only increases travel time but also potential exposure to COVID-19.
The bisecting highway is clearly visible in this aerial view of Gilpin Court (in blue) and the block groups (yellow) containing essential business destinations.
Analyzing the time-of-day transit distribution shows that the O-D pairs peak from midday to late evening, with fewer trips during the peak AM hours. Trips between Gilpin Court and essential businesses do not follow peak periods, with a higher number of trips occurring during the AM and PM peak.
Figure 5: Time-of-day trip distribution between Gilpin Court and essential businesses shows significant travel during off-peak periods.
How Can Transit Planning Support Essential Workers?
Measuring a neighborhood’s top trip destinations and time-of-day travel distribution is a powerful tool for transportation planners. It is especially useful for transit planning in low-income communities, where residents may not have access to vehicles, and instead rely on transit for essential travel.
In the case of the Gilpin Court neighborhood, planners could consider adding limited east-west transit services during the most in-demand hours between Gilpin Court and essential businesses. Connecting the residents of Gilpin Court to east-west transit routes via improved bicycle and pedestrian infrastructure could also be considered.
As low-income essential workers continue to carry a heavy societal burden during the pandemic, and are critical to re-establishing a healthy economy, we must prioritize their needs in transportation planning. As transit agencies re-establish service during the pandemic recovery period, Big Data can help them optimize services around these communities’ needs at a level of detail and speed that was previously unavailable.
What we see in our data is that our sample for Florida closely represents the population at large. Another promising proof point that our data reflects the diverse characteristics of the geographies that our customers analyze with StreetLight. Lastly, it bears repeating that any metric that is expressed as StreetLight Volume has been normalized for any local bias or sampling variation.
Going Further: An Invitation to Explore Our Data
We’ve provided the “bird’s eye” view of our sample’s representativeness in Florida, and we also want researchers and analysts to understand how that plays out when the data is converted into StreetLight Metrics.
1Note – the current StreetLight Indices for bikes, pedestrians, and trucks do not use the Census penetration for normalization, both use other grounding data instead. See the full documentation for details.
Bicycle Data to Identify Essential Employee Commutes
Bicycle Data to Identify Essential Employee Commutes
StreetLight recently ran an analysis showing where across the country bicycling has increased during COVID stay-home orders, and it got me wondering about these additional bicycle trips. We know that peak-hour bicycle commuting is down, but I wonder if these are essential employees who previously would take transit, but are wary of Coronavirus exposure.
As our economy reopens, we all want to support the essential workers making it happen, but how do we find out if that’s who is making these trips?
If your city has seen an increase in bicycling activity, you need to know who is riding, where they are riding, and why they are making those trips. This is important for prioritizing infrastructure investments — those investments would be very different if these bicyclists are essential workers who would rather ride than take transit versus recreational riders getting outdoors during quarantine.
Big Data offers fast directional findings, and that’s important for moving quickly during unstable times, with uncertain resources.
Who Is Riding?
To find out who is making these extra bicycle trips, I would start by researching traveler attributes of people bicycling. The traveler attribute information in StreetLight InSight® is based on Census-derived demographics including income, race, education level, age, and family size.
Comparing data from pre-COVID to today can uncover demographic shifts in bicycling activity. For example, if bicycle trips increased more among a lower-income population, that might indicate a swing toward hourly workers.
Figure 1: Analyzing traveler attributes for bicycling trips can help identify opportunities to support equitable bicycle transportation for low-income travelers.
The “who” is only one clue in the mystery we are unraveling. So, we’d file that information away to combine with the other details we find.
Where Are They Traveling?
You’ve probably seen more bicyclists on certain roads, but we want more than anecdotal information. In StreetLight InSight® we can separate bicycle and pedestrian travel from vehicles. We can also break up a region into zones like Census blocks, zip codes, or customized neighborhood zones. I would run a Zone Activity analysis to find out first where the highest concentration of bicycling activity occurs. I’d look to see if that data point aligns with my first finding.
Figure 2: A Zone Activity analysis of Memphis in April 2019 shows most of the city’s bicycle trips ending at the tourist area and entertainment center around Beale Street (highlighted in red).
For example, if traveler attributes showed a high percentage of lower-income people, and the Zone Activity analysis shows a concentration of bicycling in an employment area with a high percentage of hourly workers, we may want to look more closely at bicycling infrastructure that supports underrepresented populations.
For a key employment area with lots of bicycling activity, we can set up some Origin-Destination analyses to identify where trips to that zone originated. That helps identify potential routes to enhance for bicycling activity.
Why Are They Riding?
You could get the “why” data from surveys, but they come with a high price and long time frame (and may be more difficult to administer during COVID). Surveys also tend to return small sample sizes, especially for bicycling data.
Instead, we can look at the time of day these trips are occurring. Essential workers will tend to ride on off-peak hours and weekends, but that’s also when recreational bicyclists tend to ride. Combine this information with the Zone Activity analysis to see if the popular bicycling destinations are recreational or employment areas.
Combining all these data points leads toward more effective investment of resources. If a locality finds it has a high concentration of essential workers riding bicycles instead of opting for transit, they can provide more street lighting along highly traveled routes, and adjust traffic signal timing so cyclists don’t have to stop at lights during off-peak commute times. Officials may also want to explore separated bicycle lanes, secure bicycle parking, and the availability of bike-share systems.
This gives planners data to help prioritize investments in bicycling infrastructure in order to provide resources to essential workings returning to work by bicycle, or to weekend recreational rides. Fortunately, Big Data gives us the tools to quickly and easily make the distinction.