
Better Budget Planning with Big Data: 4 Ways Transportation Agencies Use Data to Build Budgets, Secure Funds, and Save Money

With transportation agencies across the U.S. facing a dreaded “fiscal cliff,” budget challenges are top of mind for many StreetLight users. Thoughout the year, but especially as fall approaches, transportation professionals are under pressure to make next year’s budget as efficient as possible, and find last-minute ways to use remaining funds effectively before they’re lost in the budget rollover.
Recent years have introduced added complexity to the budgeting process. While the Bipartisan Infrastructure Law (BIL) passed in November 2021 offered billions in new funding opportunities, the traffic disruptions of the pandemic also introduced added difficulty in anticipating travel demand, planning projects, and following through on existing plans.
But budget concerns didn’t end in 2021. Agencies of all sizes are facing limited funds while working to address a pedestrian safety crisis, returning traffic congestion, urgent emissions reduction efforts, a growing EV revolution, and lots more.
Amid these challenges, big data–powered traffic analytics are helping agencies with a few key budgeting needs:
- Planning and prioritizing next year’s projects to build effective, justifiable budgets
- Save money over traditional data collection methods with validated, on-demand data
- Secure additional funding with data-supported grant applications
- Use leftover funds quickly and effectively, before they are lost in the fiscal year turnover
Below, we’ll explore specific examples collected from panels and discussions that illustrate how shrewd practitioners are using Big Data analytics to meet these budgeting challenges.
1. Prioritizing Projects for Next Year’s Budget
At our 2020 StreetLight Summit, when many projects were in limbo, transportation professionals told us they were ramping up on planning. That way, when budgets were settled and projects could begin again, planners would be confident they’d analyzed and prioritized the most important work.
Although this was top-of-mind during the disruptions of the early COVID pandemic, this insight is evergreen. When agencies have the data to effectively prioritize next year’s projects, that data can also be used as evidence to justify next year’s budget and support its approval.
At the 2020 StreetLight Summit, planners shared examples of running multiple analyses for each project, and studying before-and-after results to measure impact of existing projects.
For example, FDOT needed to decide where to install 11 continuous bike and pedestrian counters along thousands of miles of bike trails and lanes in Florida. Planners instinctively felt that the University of Florida in Gainesville would be a prime location, and took the time to verify that instinct.
“If we are going to invest in putting up count stations that cannot be moved, we need to be confident there will actually be activity at that count station,” explained Eric Katz at FDOT.
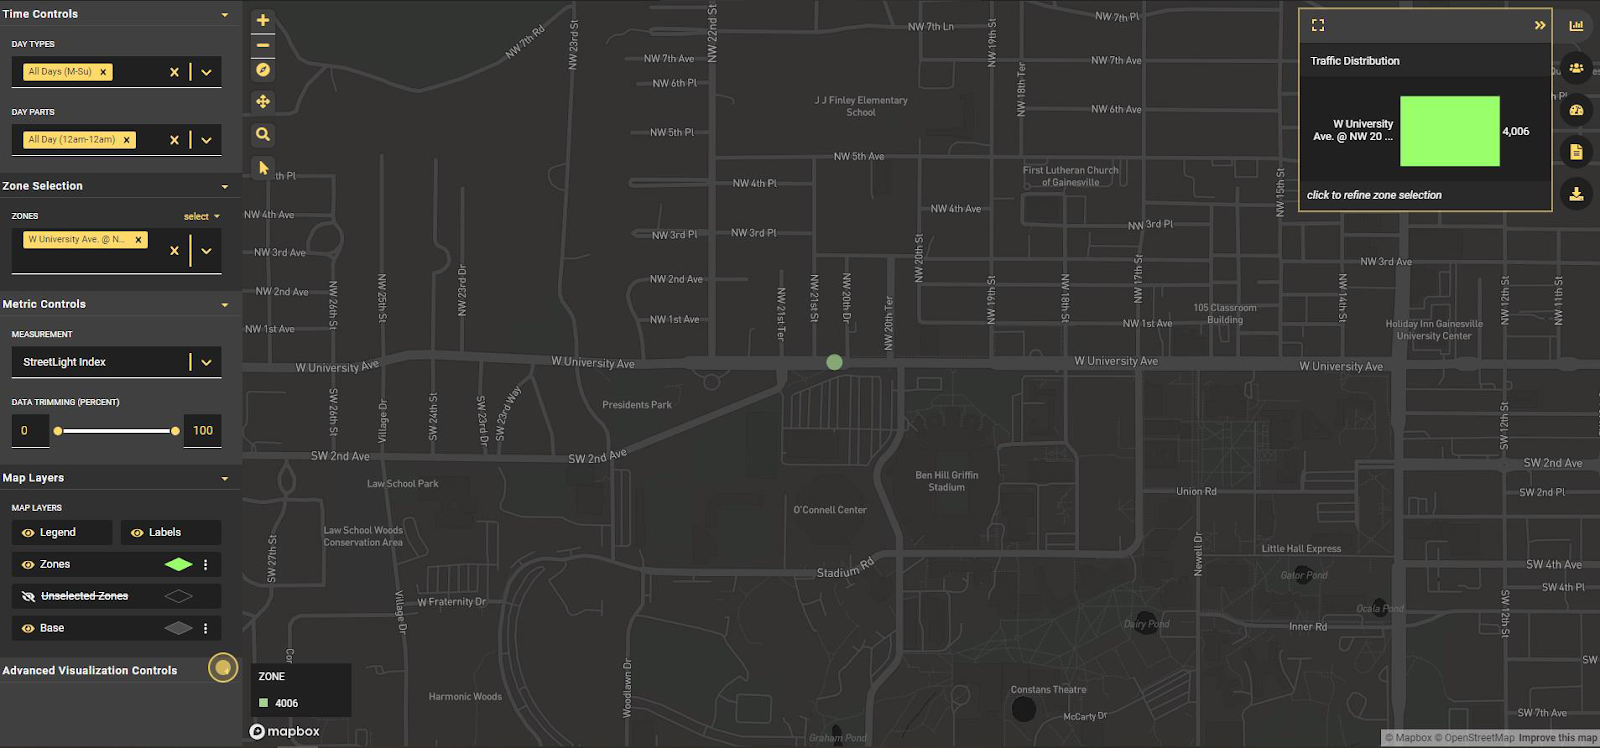
Figure 1: A Zone Activity analysis marking potential location for a continuous bike counter on University Avenue in Gainesville, Florida.
Katz confirmed a steady stream of bike/ped travel in the area, plus trip duration and trip speed, by running a StreetLight Zone Activity analysis. The study pinpointed additional Florida locations for short-term counters, including a popular bike trail in the Panhandle.
2. Save Money Over Traditional Collection Methods
To operate effectively, agencies rely on data-informed project planning. But answering key questions about existing mobility conditions can often strain budgets.
Access to on-demand traffic data is often far more cost effective than sensors or surveys, allowing agencies to operate with a more comprehensive understanding of mobility in their communities.
For example, understanding routing — where trips start and end, and the path they take along the way — often requires costly surveys that may also face sampling limitations.
But big data can provide O-D analytics at larger sample sizes without the delay or cost of surveys.
At the 2020 StreetLight Summit, Lucile Kellis of Steer shared an origin-destination analysis designed to help a transit client size unmet travel demand. First, Steer used StreetLight to identify where transit users were ultimately going to and coming from, to highlight strategic travel corridors.
Then they went further by gleaning additional insights about the travelers themselves. But rather than incur what would be an additional survey expense, Steer leveraged the StreetLight InSight platform.
“Typically our clients have a good understanding of who their customers are, but not the people who they want to attract,” Kellis explained. “Surveys are a good tool to collect that information, but we all know that good surveys are expensive and they return results with low sample size and biases. StreetLight helps us solve these issues at a much cheaper cost.”
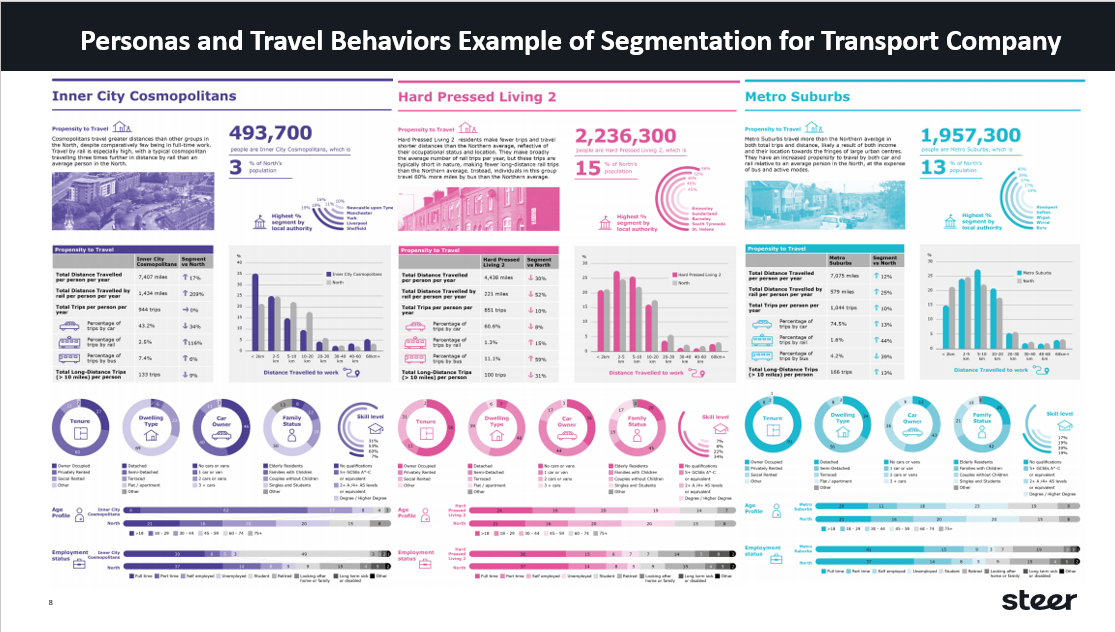
Figure 2: Using demographic information from StreetLight InSight Steer’s analysts built a dashboard capturing transit persona data.
Similarly, when MnDOT wanted to understand sources of traffic on Dodd Road, on-demand traffic analytics helped them avoid prohibitive survey costs.
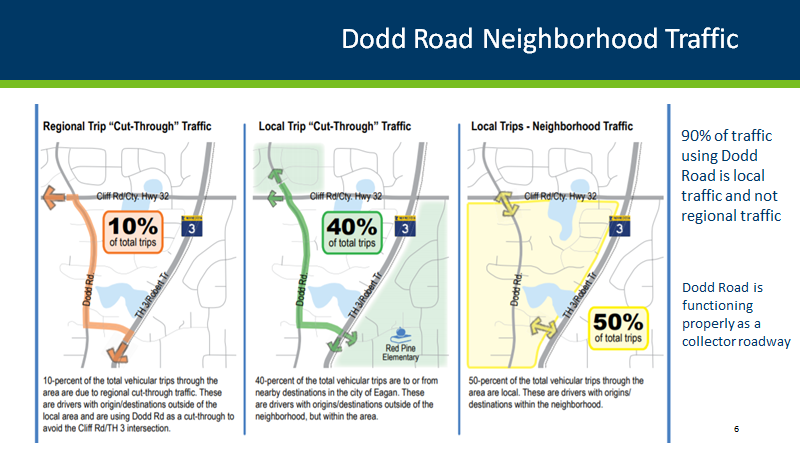
Figure 3: MnDOT’s analysis confirmed that Dodd Road’s traffic was primarily made up of local trips, not cut-through traffic.
“We normally wouldn’t answer this community question because the survey spend wouldn’t be cost effective,” says Michael Corbett at MnDOT. Corbett’s team was receiving complaints about cut-through traffic in a particular neighborhood. But with unlimited analyses via the agency’s StreetLight InSight subscription, MnDOT was able to identify the source of neighborhood traffic, and share results with constituents.
Budget limitations often demand that some concerns remain unaddressed, even for well-funded state DOTs and large MPOs. Meanwhile, small to medium-sized cities may have an even tougher time addressing resident reports of cut-through traffic, congestion and delays, or unsafe vehicle speeds.
Access to big data can allow these cities to investigate and validate resident complaints more affordably, shifting funds that would have been spent on data collection to actually implementing solutions. Plus, with information on the entire transportation network, and the ability to evaluate the impact of past projects with before-and-after analyses, cities can more confidently choose the most effective solutions and ensure funds are not wasted.
Other traditional data collection methods — such as automatic traffic counters or manual field observation — can also drive up costs. In 2019, one DOT ran a cost-benefit analysis to compare StreetLight’s platform to traditional methods and found a 50:1 benefit-cost ratio (click here to learn more about cost-benefit analyses).
3. Secure Grant Funding
Data-supported grant applications help agencies stretch their budgets and fund projects that might otherwise end up on the chopping block or face considerable delays.
To tell a story grant administrators want to hear, agencies need evidence that their proposed project will significantly benefit their community. But as we’ve explored above, traditional data collection can be costly and time-consuming, leaving agencies with a catch 22.
Big data can help build a compelling grant application with clear visualizations and benefit-cost analyses using recent, validated data on existing conditions.
For example, when ODOT sought funding for Phase 4 of a multi-year, $1.3 billion highway restructuring project, they used StreetLight metrics and visualizations to secure a $25 million Infrastructure for Rebuilding America (INFRA) grant.
Big data has also been pivotal in securing funds for safety projects. Agencies that have leveraged StreetLight for Safe Streets and Roads for All (SS4A) applications have won ~$8 Million in SS4A grant funding.
4. Use Funds Effectively Before It’s Too Late
Because many agencies have use-it-or-lose-it funds, the end of the fiscal year often adds urgency to fund implementation. How can agencies use leftover funding effectively for their communities, with limited time left in the year?
Because big data analytics don’t face the same delays that traditional data collection methods do, they can allow agencies to quickly identify optimizations on existing roadways and allocate funds for quick fixes like signal retiming or optimizing bus schedules.
Big data can also help agencies funnel these leftover funds into planning for next year.
For example, when planners in the Shreveport, Louisiana area had concerns about traffic congestion and safety, they used StreetLight to get a comprehensive look at regional traffic, pinpoint congestion hotspots, and quickly build a data-supported mitigation plan.
This approach also relieves budget stress by allowing managers to use their staff resources more efficiently. Chris Petro, AICP, of the Northwest Louisiana Council of Governments (NLCOG) put it this way: