Skip to Main Content
UPCOMING WEBINAR | Safer Streets, Sooner: Using data to support the most impactful interventions | Register Now
App Developers & ConsultantsCreate unique products using StreetLight’s rich datasets and APIs.View Developer Resources
Marketplaces & ResellersOffer StreetLight’s datasets to help your users achieve better outcomesBecome a Reseller
Data PartnersHave data that could enrich StreetLight’s analytics? Talk to us.Become a Partner
Company
Discover our journey from pioneer to industry leader
Learn more about us
Featured report

Transportation Climate Impact Index: How metros rank across 8 key factors

View report
Get Started
Products
For Government
For Consultants
Transportation Systems Management and Operations (TSMO)
Traffic Monitoring
Plans
App Developers & ConsultantsCreate unique products using StreetLight’s rich datasets and APIs.View Developer Resources
Marketplaces & ResellersOffer StreetLight’s datasets to help your users achieve better outcomesBecome a Reseller
Data PartnersHave data that could enrich StreetLight’s analytics? Talk to us.Become a Partner
Company
Discover our journey from pioneer to industry leader
View All Company
About UsCareersPressUniversity ResearchData Privacy
Category: Transit

What Are Complete Streets and How Can Analytics Help Us Build Them?

What Are Complete Streets and How Can Analytics Help Us Build Them?

Focusing on car-centric infrastructure can compromise roadway safety, increase emissions, and leave many without a reliable way to get from A to B. But Complete Streets policies promote safe and equitable outcomes for all road users.

person biking on complete street

We have a tendency, particularly in the U.S., to design roads for cars and trucks. Decades of vehicle-centric city planning have exacerbated this tendency, as sprawling metropolises make travel by car essential for most Americans.

This focus on car-based travel leaves many people behind. Pedestrians and cyclists face unsafe roadways without bike lanes, sidewalks, or crossings. Those who cannot drive or afford a car struggle to get to work via transit or access essential resources like grocery stores and doctors. People living near congested highways — predominantly communities of color [1] — suffer the effects of both noise and air pollution, impacting health outcomes.

In the face of these realities, we need a paradigm shift in how we design streets. Instead of vehicle-first transportation systems, we need people-first transportation systems. And this new paradigm is already gaining ground through programs like Complete Streets.

What are Complete Streets?

“Complete Streets” is an approach to roadway policy and design that focuses on enabling safe mobility for all road users — drivers, pedestrians, bikers, and public transit riders alike, across the full spectrum of ages and abilities. [2]

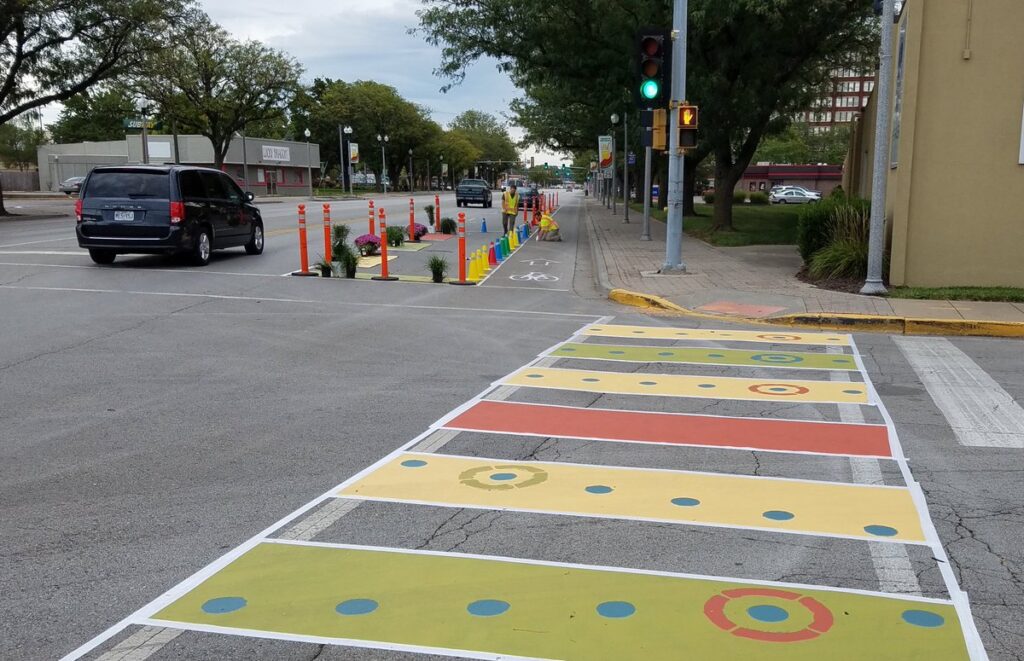
For example, a Complete Streets policy may call for the implementation of pedestrian traffic signals that are accessible to those with visual impairments. Policies may also call for added bike lanes and bus lanes to improve safety and access to these transportation modes, or the implementation of curb extensions, crosswalks, and daylighting to provide safer paths for pedestrians.

Armour Road with traffic calming measures
Workers install a new bike lane on Armour Road in North Kansas City, Missouri, leading to a safer roadway and more bike traffic.

Many public officials at the local, regional, state, and federal levels are working to build better bicycle, pedestrian, and transit infrastructure through Complete Streets policies. The concept of Complete Streets is now mainstream in transportation, with planners striving to design and build streets that safely accommodate all transportation modes and users. In fact, according to the National Complete Streets Coalition, over 1,700 Complete Streets policies have been passed in the U.S., including those adopted by 37 states, Puerto Rico, and Washington D.C.

In this article, we’ll discuss several benefits to Complete Streets and how we can leverage transportation analytics to build more of them.

Why are Complete Streets more equitable?

Streets with multimode infrastructure offer more ways to travel, increasing mobility for everyone. Whether they drive, bike, walk, or use public transit, Complete Streets give them ways to get from point A to point B. This is especially crucial when point B is an essential resource like food, healthcare, work, or school.

Vulnerable populations, including people of color, people with disabilities, and those who are impoverished or experiencing homelessness are less likely to own or drive a car. Ensuring that non-car travel options exist increases access to mobility for these groups while also benefiting other travelers.

It’s important to note that the existence of non-car travel options doesn’t always ensure the accessibility of these options. Here, we mean accessibility in multiple senses — accessible for people with disabilities and accessible more broadly for all road users. Even when non-car mode options exist, there can be barriers to their use such as inadequate seating at bus stops or English-only signage.

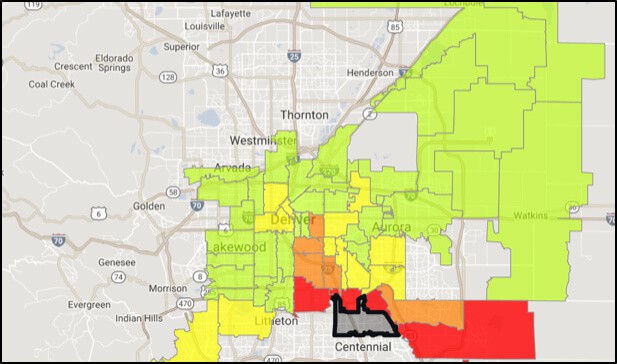
In the video below, Alex Bell of Renaissance Planning explains how he used multimode analytics from StreetLight to compare mode availability to mode utilization in order to diagnose barriers to access for vulnerable populations.

Access to non-car transportation options can also help ensure fewer people suffer from homelessness. According to Jacob Wasserman, a researcher at UCLA who conducted a meta-analysis on transportation and homelessness,

“Homelessness is first and foremost a housing problem, but transportation is so intimately tied into housing. People can only live in places they can afford, which is sometimes really far from [the things they need to reach] because of our transportation decisions.” [3]

And because Complete Streets allow more opportunities for non-car travel, they also reduce overall Vehicle Miles Traveled (VMT), leading to improved air quality and less noise pollution for people living near highways, a group made up disproportionately of communities of color. That brings us to the next question….

Why are Complete Streets more climate-friendly?

Transportation is the top source of greenhouse gas (GHG) emissions in the U.S., at 27% in 2020, according to the EPA. That means the transportation industry has a critical role to play in addressing climate change.

Because Complete Streets reduce our reliance on single-occupancy vehicle (SOV) trips by making it easier to use shared mobility and active transportation options, they also lower total Vehicle Miles Traveled (VMT). By reducing the number of cars on the road, Complete Streets also help reduce traffic congestion, which means less time stuck in traffic with the engine running. With fewer miles traveled and less time spent in cars, emissions drop and air quality improves.

Adding Complete Streets infrastructure to existing roads can also have the effect of calming traffic. For example, road diets — which reduce the number of vehicle lanes and often repurpose the space for multimodal infrastructure — tend to reduce vehicle travel speeds and vehicle throughput without causing the congestion that would lead to increased emissions. Since vehicles are less fuel efficient and emit more CO2 per mile traveled at higher speeds, this means multimodal Complete Streets infrastructure can sometimes double as traffic calming measures that reduce emissions while also improving safety.

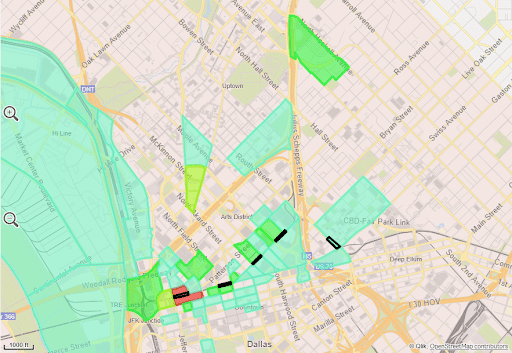
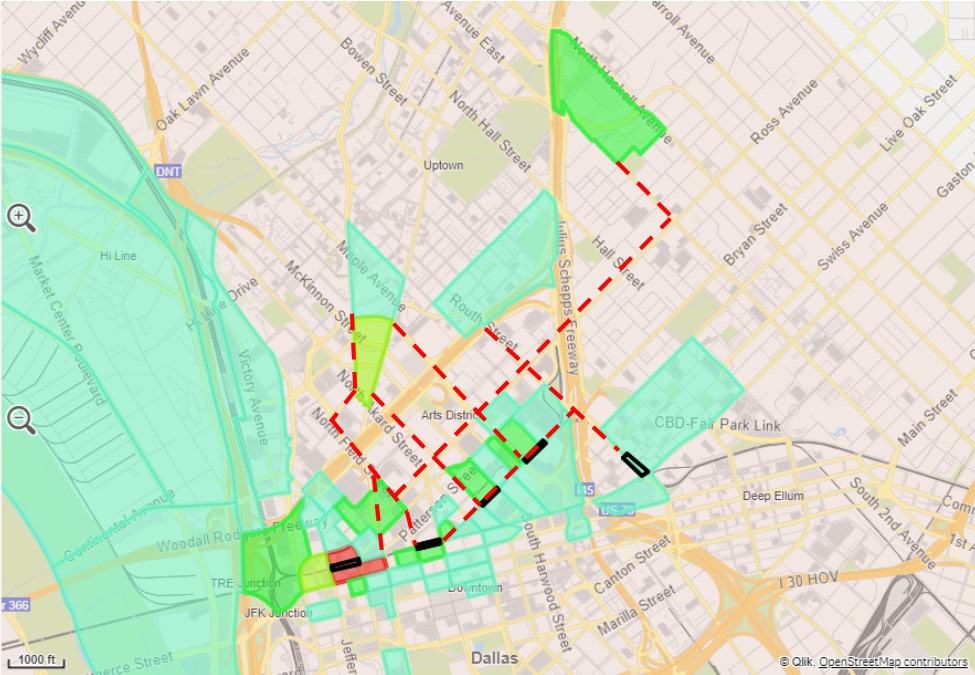
In the example below, AEC firm ATCS identified opportunities to invest in multimodal infrastructure on Route 234 Business in Prince William County, Virginia with the goals of reducing congestion, increasing safety, and making travel more sustainable.

Creating these opportunities for mode shift is crucial to decarbonizing our transportation networks, although they are just one strategy we can use to reduce overall emissions. We explore additional strategies in our free guidebook, Measure & Mitigate: Transportation Climate Data Solutions.

Why are Complete Streets safer?


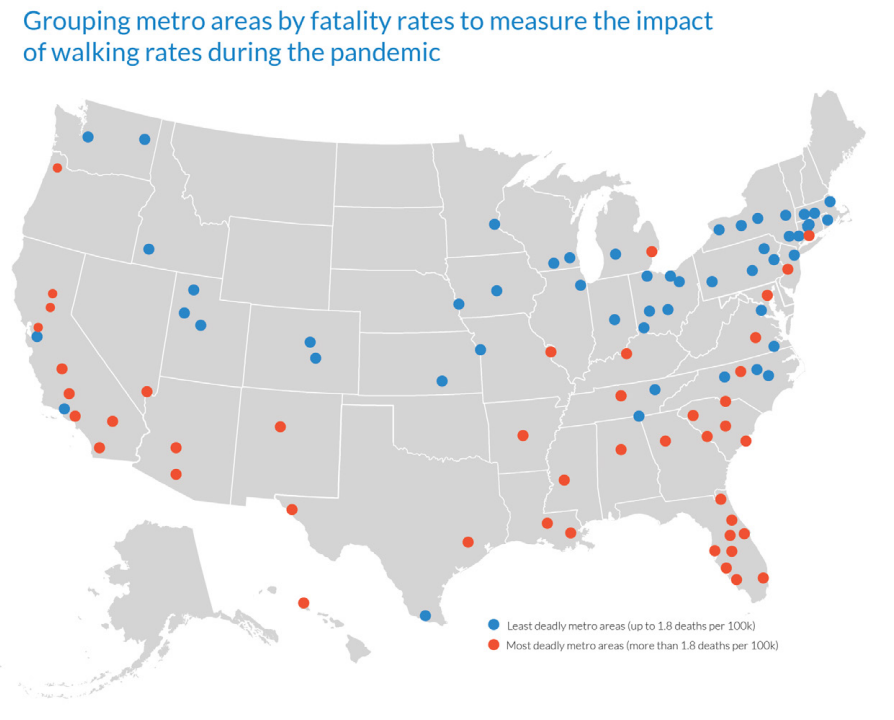
As roads emptied and travel speeds increased during COVID, severe crashes spiked. This made many cities less safe for bikers and pedestrians in particular, highlighting the urgency of infrastructure improvements and traffic calming measures to make streets safer.

Map Most and Least Fatal
Smart Growth America’s map of most deadly vs. least deadly metro areas for pedestrians.

When streets lack multimodal infrastructure like signalized crossings and bike lanes, that doesn’t prevent non-car road users from needing to travel. Many still need to walk, bike, or use public transportation in order to access basic necessities, forcing them to brave streets that lack the infrastructure needed to keep them safe as they travel.

Adding accessible sidewalks, crossings, bike lanes, bus lanes, signage, and other Complete Streets infrastructure helps ensure that not only can people travel, but they can do so safely.

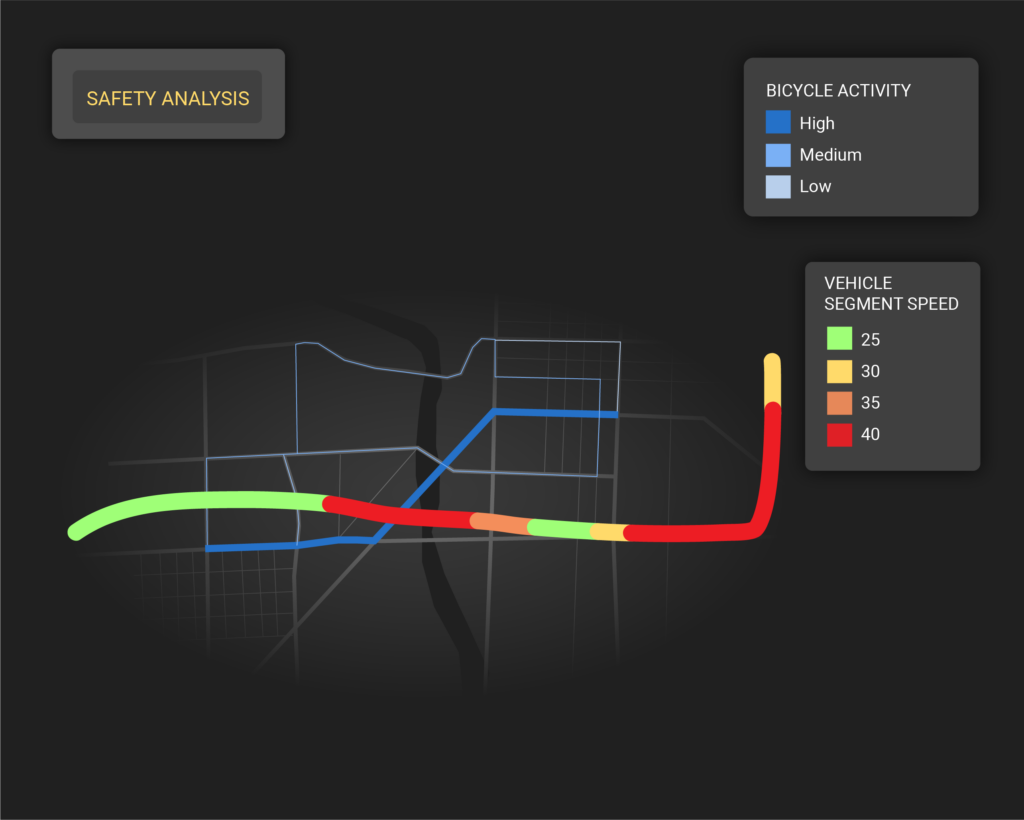
Complete Streets improvements may also mean making streets safer not just for travelers, but also for road workers, outdoor patio diners, and homeless people sheltering under overpasses or asking for help at intersections. In the example below, the City of Pasadena implemented various traffic signal timing techniques to reduce the speed on corridors with outdoor dining, as well as other arterials.

For more strategies to make streets safer, download our free Safety Handbook.

How can we build more Complete Streets?

With all these benefits to Complete Streets, how can transportation professionals make headway on ensuring more of our streets serve all road users?

Implementing official Complete Streets policies can provide the incentive and accountability to get started. In the U.S., the Federal Highway Administration (FHWA) offers guidance for transportation agencies looking to establish Complete Streets policies. [4]

In addition to this guidance, federal funding is available to help with Complete Streets projects. Grant programs like Safe Streets and Roads for All (SS4A), the Reconnecting Communities Pilot (RCP) Program, and Rebuilding American Infrastructure with Sustainability and Equity (RAISE) help agencies secure funding for planning and implementing Complete Streets projects.

The Federal Transit Administration has also waived the local funding match requirement for Complete Streets planning activities to receive funding through the federal State Planning and Research Program (SPRP) and Metropolitan Planning Program (MPP) through the end of 2026.

Because so many factors might go into making streets “complete,” — bike lanes, bus stops, signage, sidewalks, well-timed traffic signals, and so much more — understanding existing roadway conditions, mode usage, traveler demographics, and the impact of past projects are key. This is where digital transportation analytics come in to help agencies identify high-priority improvements and develop data-supported implementation plans.

safety analysis in StreetLight InSight platform
StreetLight InSight® allows users to compare bike activity to trip speed info to pinpoint where bikers may face dangerous road conditions.

Transportation analytics for Complete Streets

The right data is necessary to identify and prioritize high-impact roadway improvements, secure project funding, and earn public and political buy-in for your proposed solutions. While traditional data collection methods like sensors and surveys offer helpful data points to support these goals, they often present limitations in scope and sample size. Digital, on-demand transportation analytics fill in the gaps to enrich our understanding of travel patterns and the needs of road users.

Because installing new multimodal infrastructure can be costly and time-consuming, one of the easiest ways to make streets more complete is to evaluate the performance of existing infrastructure and identify opportunities for optimization.

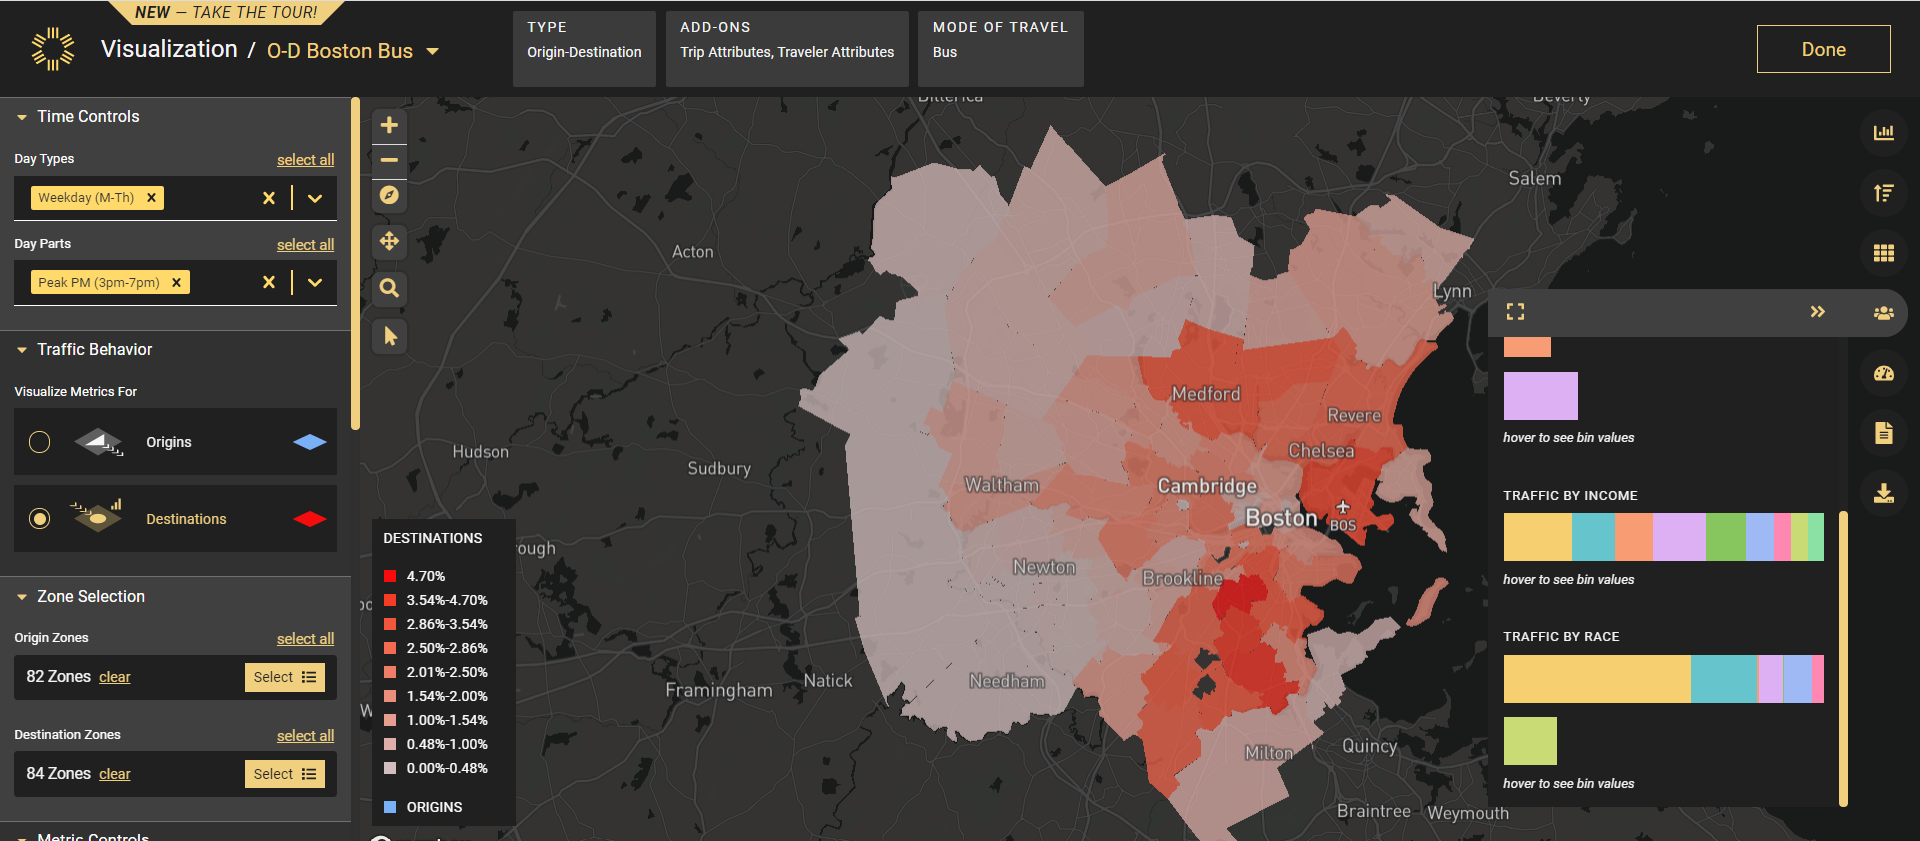
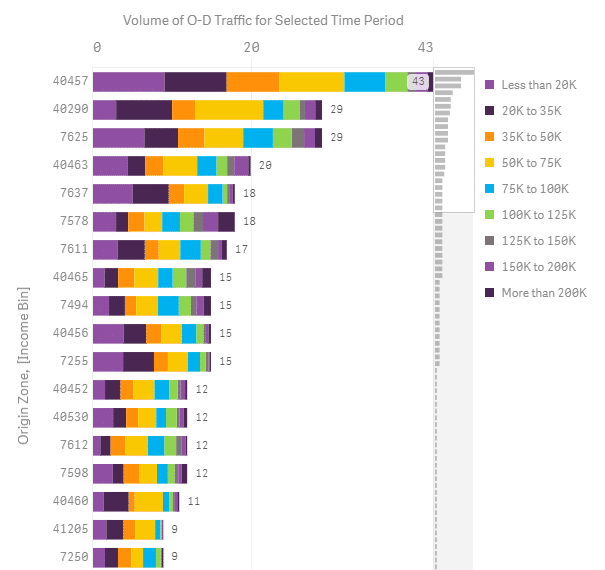
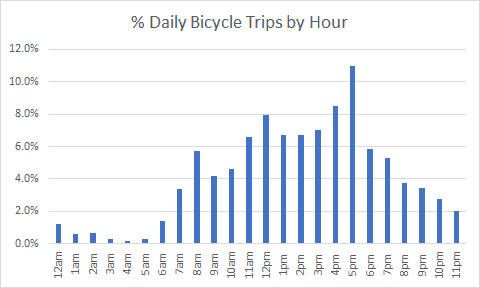
Say you wanted to optimize bus schedules or add stops to an existing route to adapt to shifting travel demand. An Origin-Destination (O-D) analysis using digital traffic data can illuminate where lots of people are traveling between work and home, while the ability to view traffic volumes by time of day can help determine when most people need to travel. Aggregated demographic data can also be overlaid onto travel patterns to understand where vulnerable populations would most benefit from added stops.

For example, when commuting patterns shifted after COVID, bus ridership in San Francisco dropped disproportionately to other modes. On-demand transit metrics helped SamTrans understand shifting travel behaviors and boost bus ridership by 30% after adjusting bus schedules.

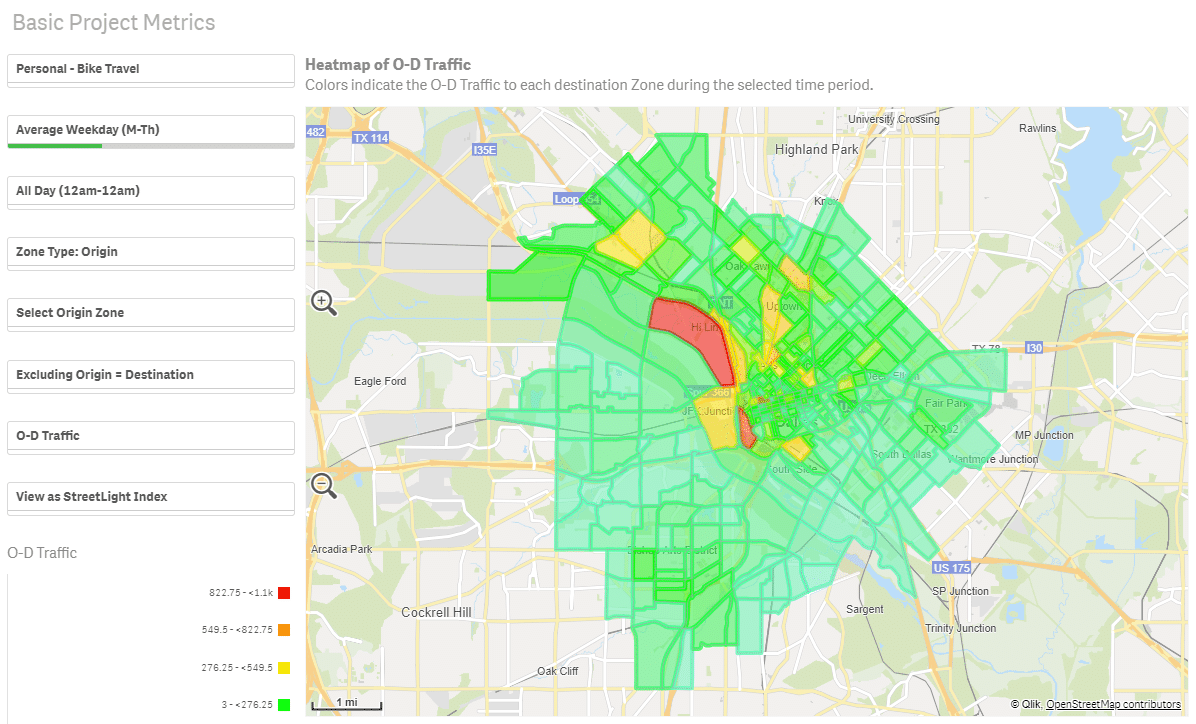
When installing new infrastructure such as a bike lane or pedestrian bridge, digital analytics help agencies prioritize high-impact locations to invest in multimode infrastructure. For example, one Parks & Rec group used O-D analysis to determine the daily number of bikeable trips (five miles or shorter) to a target destination, justifying their investment in a new trail and bridge facility.

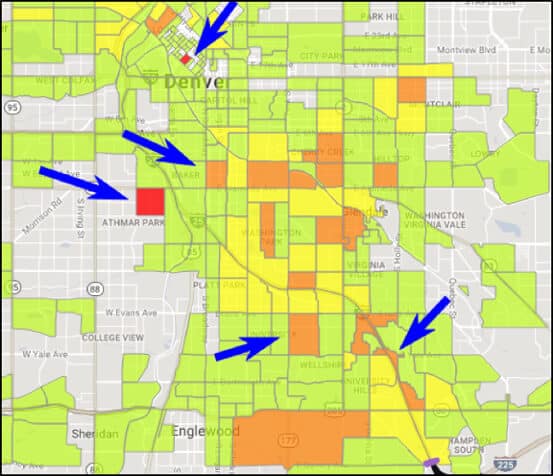
Similarly ATCS used digital transportation analytics to develop a multimodal scoring system for DC DOT that would help them pinpoint infrastructure gaps and determine where new projects were most needed:

Want to learn more about how digital transportation analytics can power effective Complete Streets initiatives? See how on-demand traffic data supports:

  1. Active Transportation modes
  2. Bus and rail
  3. Road safety
  4. Transportation equity
  5. Climate solutions
  6. Federal grant applications
  1. Yoo Min Park and Mei-Po Kwan, “Understanding Racial Disparities in Exposure to Traffic-Related Air Pollution: Considering the Spatiotemporal Dynamics of Population Distribution.” Int J Inviron Res Public Health 17 (Feb 2020): 908.
  2. U.S. DOT, “Complete Streets,” August 2015.
  3. Kea Wilson, Streetsblog USA. “Three Ways DOTs Can Help the Unhoused – On and Off the Road.” February 23, 2023.
  4. Federal Highway Administration (FHWA), “Make Complete Streets the Default Approach.” February 2023.

Make streets safer with data-informed infrastructure planning

Download Safety Handbook

Ready to dive deeper and join the conversation?

Explore the resources listed above and don’t hesitate to reach out if you have any questions. We’re committed to fostering a collaborative community of transportation professionals dedicated to building a better future for our cities and communities.

Get Started

StreetLight Releases On-Demand Bus and Rail Metrics for Transit

decoration image of city layout

StreetLight Releases On-Demand Bus and Rail Metrics for Transit

transit bus passengers

The COVID-19 pandemic created unprecedented challenges for transit systems across the country. As ridership has plummeted, transit systems face substantial budget and service cuts. 

But transit will be a critical element of the new U.S. government administration’s emphasis on climate-friendly transportation. How can our transit systems bounce back? 

StreetLight can now offer even stronger support to those researching transit’s past and planning for its future. StreetLight InSight® has added on-demand Bus and Rail Metrics for the U.S. and Canada, now included in our Multimode subscription.

Understand Who Takes Transit Where

Just as with our Bike and Pedestrian Metrics, Bus and Rail Metrics provide a suite of powerful data tools for analyzing travel behavior, including changes over time. Flip open your laptop and instantly access what you need: 

Our current data offering encompasses key months of 2019 and 2020. We are continually expanding and updating Transit and all other StreetLight Metrics.

Rebuild With Climate-Friendly Transportation

Data-driven insights from our enhanced Transit Metrics can help transportation planners, transit system managers, and other agencies support increased calls to build carbon-friendly travel networks. Transit data, with a lower carbon footprint than single-passenger vehicles, can support a fact-based strategy for post-pandemic recovery across all travel modes. 

For example, planners can compare specific route ridership levels in a pre-COVID time period in 2019 to the same time period in 2020. This helps highlight macro-level trends, such as where ridership rose or fell. They can also analyze O-D pairs to understand and adjust high- or low-demand travel routes.

Fact-based intelligence can assist in rebuilding transit ridership, lowering a city’s carbon footprint by shifting vehicle travel to bus and rail. 

Make Travel Truly Equitable

Title VI requires that transit routes serve all metro regions equitably, and demographic information is critical for social equity analyses. Transportation planners can use our O-D Metrics for Bus and Rail modes to understand how transit ridership matches demographics in the travelshed areas for various transit stops. 

With a deeper understanding of passenger demographics, planners can determine which lines have the highest proportion of low-income riders. They can also compare those demographics with the Census Block Groups where stops are located.

As a sample use case, we ran an O-D analysis using our Bus Metric with Trip and Traveler Attributes for a four-month period in 2019. This analysis of Massachusetts Bay Area Transit (MBTA) bus passengers with trip destinations in the greater Boston area illuminated the following insights:

Chart Bus Boston

Figure 1: Visualizing Boston’s transit ridership by income and race in StreetLight InSight®. 

We also analyzed Bay Area Rapid Transit (BART) morning commute ridership on a transit line between the East Bay and San Francisco comparing April 2019 to April 2020.

Comparing this data to a city’s overall demographics can provide a deeper understanding of how reliant low-income residents are on bus and rail transit, proportionate to the population at large. These insights can help planners visualize where resources may need to be re-distributed along routes.

Trust Validations Against Leading Agency Counts

StreetLight’s Metrics are derived from several types of data, including general Location-Based Services (LBS) data and well-validated bus and rail ridership counts.

We confirmed strong correlation between the StreetLight Index and rail station-level monthly total ridership statistics, published by BART, MBTA, and the Chicago Transit Authority.

Figure 2: High correlation between StreetLight and transit station counts.

We confirmed strong correlations between the StreetLight Index and bus stop-level monthly total ridership statistics, published by Los Angeles County Metro Transportation and Central Ohio Transit Authority.

For more about our Transit Metrics methodology and validation, see the technical details in our extensive Bus and Rail Methodology and Validation White Paper.

Exploring Bike Infrastructure Opportunities in Dallas

decoration image of city layout

Exploring Bike Infrastructure Opportunities in Dallas

With the right support and infrastructure, bikes can extend access to and from other modes like transit, serving an important last-mile connection. In fact, as transit ridership drops in the U.S., boosting bike infrastructure may help reverse that trend. A recent study by researchers at the University of Kentucky found the introduction of bike share increases rail ridership.

Bike riding is not only a healthy and affordable method of transportation, it’s also an important mode to link with public transit and extend mobility options. But bike-riding numbers in the U.S. are still quite low.

Dallas is one city that recently took a closer look at the bike-rail transit connection, with an eye to identifying where bike infrastructure could be improved.

Bike Infrastructure for “Complete Streets”

Many public officials at the local, regional, state and Federal levels are working to build better bike infrastructure. The concept of “complete streets” is now mainstream in transportation planning, as all levels of government strive to design and build streets that safely accommodate all transportation modes and users.

But the reality is that government agencies have a lot of competing priorities. Practically and financially, public agencies will never have sufficient resources to perfectly accommodate every type of user on every single road. However, they can, and should, prioritize complete networks for all modes, addressing coverage and gaps strategically.

We recently put together a report for Dallas officials interested in exploring options for evaluating bike infrastructure and prioritization.

webinar on laptop and mobile device

Here is how we applied those metrics to the Dallas analysis.

1.  Prioritize corridors for bike infrastructure. Our analysis helped us understand Dallas bicycle trip origin/destination patterns. This sort of analysis can be run in minutes for any type of geography in any location in the U.S. and Canada. The map below depicts the start locations of bicycle trips that end near light rail stations in downtown Dallas.

Heat map shows concentration of bike trip origins, with the red zone revealing a higher number of bike trip destinations.

Fig 1: Heat map shows concentration of bike trip origins, with the red zone revealing a higher number of bike trip destinations.

A closer look at bicycle trip origins that end near five light rail stations in downtown Dallas.

Fig 2: A closer look at bicycle trip origins that end near five light rail stations in downtown Dallas.

Knowing the origin and destination of bike trips helps transportation officials prioritize corridors for bike infrastructure. Additionally, a before/after analysis can be run to measure change in bike trips to/from light rail stations.

Proposed corridors to prioritize for bike infrastructure.

Fig 3: Proposed corridors to prioritize for bike infrastructure.

2.  Understand characteristics of who is traveling by bicycle. Next, we applied a demographic overlay to our analysis. Not only could we see where and when trips are made, but who is actually making them. Understanding the demographic characteristics of transportation users is critical to designing a system that is accessible and useful to everyone.

Income distribution for bicycle trips, summarized by origin.

Figure 4: Income distribution for bicycle trips, summarized by origin.

3.  Understand relative bicycle activity levels throughout the day. Finally, we analyzed levels of bicycle activity at specific locations throughout the day to identify peak bike commuting times. We did this because connections to light rail stations involve operational elements in addition to physical bike infrastructure. For example, traffic engineers can help ensure safe, efficient travel for bicyclists when timing traffic signals to accommodate busier travel times and corridors.

Percentage of bicycle trips by hour for Commerce Street in Dallas.

Fig 5: Percentage of bicycle trips by hour for Commerce Street in Dallas.

As Dallas works to build a world-class transportation system for current and future travelers, it will need high-fidelity data for all modes to make the right decisions. Regardless of the size or location of a city, planners across the country can rely on Big Data to inform recommendations and drive decisions.

Big Data and Public Transit: Measuring Vehicle Trips to Help Modeshift

decoration image of city layout

Big Data and Public Transit: Measuring Vehicle Trips to Help Modeshift

interior of city bus
 

Public transit is a key component of cities’ mobility networks, especially in dense urban centers. Trains and buses help commuters avoid the hassle of traffic jams on congested roadways, not to mention pricey parking. But some cities are attracting commuters and residents so quickly that public transit cannot keep up — just ask anyone who lives in Denver, Colorado.

The population in Denver has grown by ~45% since 1996, and the average commuter there now spends 49 hours per year sitting in traffic, but only 4.4% of commuters use public transit (Source: Denver Post). Similar scenarios are playing out across the US in cities like Austin, Seattle, San Francisco, and more. Even though alternatives to driving are available in many of these growing cities, not enough commuters are using them – and congestion keeps getting worse.

Traditionally, public transit planners improve systems by looking at existing transit users’ behavior. They identify potential users as those who live and work near transit stations. But in this era of rapid urban population growth, we cannot consider these groups alone: What about the people who are driving because transit isn’t currently a viable option? What about the people who could be using the transit to commute, but aren’t? In this blog post, I’ll walk you though a few ways Big Data can help address these questions.

First, let’s define our terms. When we talk about Big Data, we mean the massive volume of location records that are created by mobile devices, connected cars, and connected trucks every day. You can read more about our Big Data sample here. I’m not talking about the type of ridership data that comes from payment and parking systems – most transit planners already have those resources their fingertips.

Big Data is ideal for revealing opportunities for planners to convert vehicle trips to other modes. Here are the key two ways to do this:

Next, I’ll walk you through these two strategies in more detail using a few real-world examples.

webinar on laptop and mobile device


Scanning Large Areas

A key advantage of Big Data is that you can analyze at travel patterns across very large area, such as an entire region or even an entire state. This means you can measure the travel activity of populations that might not respond to your survey – or that you wouldn’t have considered surveying to begin with. Big Data makes it easy to go beyond current transit riders to better understand the travel behavior of drivers – the people that planners are often trying to shift onto transit. To show you how this works, we’ll walk you through a study we created for Denver, CO.

First, we ran large origin-destination (O-D) study of Metro Denver’s ZIP codes in StreetLight InSight, our online platform for analyzing travel behavior with Big Data. (See Figure 1 below.) This type of high-level O-D study can show planners where the greatest number of people start and end their trips. If your goal is to convert as many vehicle trips to transit as possible, it’s best to start with the routes that are most popular.

This heat map visualizes the top origin ZIPs for trips to the Denver Tech Center ZIP, which is outlined in black.

Figure 1: This heat map visualizes the top origin ZIPs for trips to the Denver Tech Center ZIP, which is outlined in black.

This study quickly revealed that one of the popular destinations of vehicle trips is the Denver Tech Center. It takes about an hour to travel by train from Denver’s downtown train station to the Tech Center. During the morning rush hour, driving takes about the same amount of time due to heavy congestion in the peak period. This offers transit an opportunity to compete for that market.

Our analysis showed that a large share of trips – more than 30% – originate in the ZIPs adjacent to the Tech Center. Investing in bus rapid transit that quickly carries commuters from neighboring ZIPs to the Technology Center should be effective there. Getting those vehicle trips off the road will also help clear the way for drivers that are coming from further a field.

Drilling Down

When people think of “Big Data,” they typically think it’s best for understanding travel patterns at a very high-level; for example, analyzing regional trends and major highways. While that’s absolutely true, these types of studies only scratch the surface of what Big Data can do. Here at StreetLight Data, our navigation-GPS data have 5-meter spatial precision on average, which means we can look at geographies as small as an intersection or off-ramp.

When it comes to public transit, this ability to drill down is really useful.  Let’s go back to our study of Denver to illustrate. We know there’s a train in Denver that riders can take right from downtown to the Technology Center in about an hour. Why aren’t drivers taking that train?

To figure this out, we did a TAZ-level analysis of vehicle trips to the Technology Center that take I-25, which follows the route of the train. (See Figure 2 below.)

This shows the origin TAZs of trips to the Denver Technology Center that use I-25

Figure 2: This shows the origin TAZs of trips to the Denver Technology Center that use I-25 (that’s the purple gate in the lower left of the image) and thus are likely to pass a train station on the way. The blue arrows point to the 5 TAZs with the greatest volume of trips originating there.

When we dug deeper, we also saw that 3 of the 5 TAZs with the highest volumes of vehicle trips to the Tech Center during peak AM hours have either a high school, middle school, or elementary school. It’s very likely that parents are dropping their kids off at school before proceeding on to the Denver Tech Center, and it would be difficult for parents to get their kids to school on the train.

With this type of information, planners can turn to innovative tactics to encourage transit adoption – for example, they could talk to local schools about coordinating parents to carpool to work after dropping their kids off. They could also incentivize this type of behavior with more high-occupancy vehicle or “carpool” lanes.

Another issue could be insufficient transit connections from some of the high-volume TAZs to the train. By investing in more bus, bike, and pedestrian options that make it easy to get to the train, planners can make it more convenient and efficient for drivers to switch to transit.

Putting It All Together

As we’ve demonstrated with our analysis of Denver, Big Data can reveal the key places for transit planners to prioritize expanding their systems. It can also help show why some drivers that could use transit alternatives don’t. But that’s just the beginning.

Big Data can also be helpful for identifying where first-mile and last-mile solutions are most needed – and which types of solutions are the best. Want to learn how we can help with those types of challenges? Let us know in the comments below!