What Is a Smart City?
What Is a Smart City?
Smart cities use innovative technologies to improve operations, expand access to goods and services, and get things done more efficiently. At the center of it all, transportation data is changing how cities make decisions that impact how people move.

Today, nearly everything has become “smart,” from phones to fridges, doorbells, and cars. And cities are no exception. Across the globe, cities large and small are adopting new technologies to improve quality of life, automate essential services, and integrate with the digital world.
So how exactly are “smart city” technologies changing how we live? And what role does transportation data play in making our cities “smarter”?
In this article, we’ll discuss:
- What is a smart city?
- Smart city technologies in use today
- How smart cities use transportation data
- Real-world examples of smart city transportation projects
What Is a Smart City?
A smart city is a city that uses data to optimize operations, planning, and governance. Data collected from residents and visitors, electronic devices and systems, and the broader Internet of Things is analyzed to understand patterns, monitor how things are going, communicate with constituents, and more.
If this all sounds incredibly broad, it is. Most cities today are smart cities, because data collection and analysis have become ingrained in just about everything we do.
Still, the extent and sophistication of data usage varies greatly from city to city. Below, we’ll explore some of the common ways smart cities are using this data.

Smart City Technologies
There are many types of smart cities technologies in use today. Some common examples include:
- Real-Time Transit Tracking – GPS data from buses, subway cars, etc. are used to calculate wait times for public transit, communicated via mobile apps or station signage.
- Energy & Utilities Optimization – usage data for electric grids, water, and more can be monitored and in some cases automatically adjusted to prevent service disruptions, detect leaks, anticipate the need for infrastructure improvements, or aid conservation efforts.
- Smart Lighting – light detection technology can be used to automatically turn on overhead lights for roadways, parking lots, and more during poor lighting conditions (not just at nighttime).
- Smart Traffic Signals – smart traffic lights use real-time data on the volume and speeds of vehicles approaching an intersection to automatically adjust the timing of signals to reduce idling time, improve traffic flow, or prevent unsafe conditions.
- Air Quality Monitoring – sensors may be deployed throughout the city to monitor air quality, detect potential sources of pollution, communicate current conditions with the public, and inform air quality improvement efforts.
These and other technologies are becoming more and more common in cities across the globe. But one of the most frequently used forms of smart city technology is transportation intelligence. Below, we’ll discuss some of the key ways smart cities are using transportation data to improve mobility, air quality, climate impact, and more.
See how data can help you fix traffic jams, speeding, and more
Download Transportation Data GuideHow Smart Cities Use Transportation Data
Data on how people and vehicles move can help cities plan roadway infrastructure improvements, make land-use decisions, plan for special events, reduce traffic fatalities, monitor public health, boost economic activity, reduce commute times, mitigate greenhouse gas emissions, and so much more.
In many cases, cities will install physical sensors on the road that capture data on vehicle volumes, speeds, turning movements, and more. But these sensors are too expensive to install on every roadway, and they may not capture non-vehicle traffic such as bikes and pedestrians.
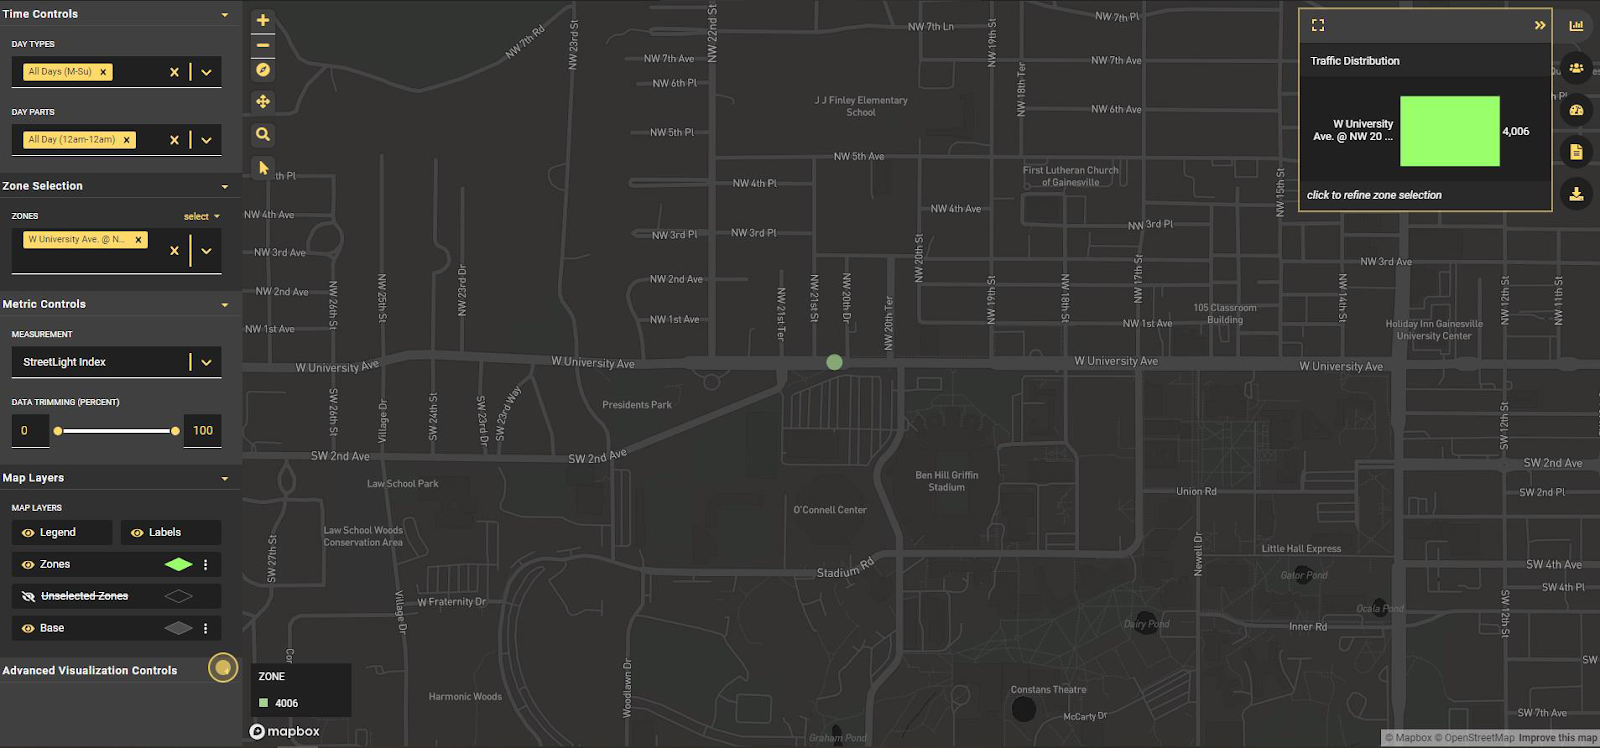
To get more comprehensive and cost-effective insights on how people move, cities often supplement physical roadway sensors with big data analytics. Big data platforms like StreetLight collect, process, anonymize, and validate massive numbers of datapoints from connected devices and the Internet of Things to make precise inferences about how people move.
Data privacy assurances are crucial when collecting big data on mobility. That’s why StreetLight’s Route Science® algorithm anonymizes and aggregates all datapoints, to ensure individuals can never be identified or tracked.

In addition to smart traffic signals (mentioned above), which typically use data on vehicle volumes and speeds, there are many other ways cities are using transportation data. Common examples include:
- Vehicle volumes to fix traffic jams, ensure smooth traffic flow during special events, and prioritize infrastructure investments
- Speed data to understand where congestion or unsafe speeds are impacting mobility for residents and visitors
- Turning movement counts to help time traffic signals
- Origin-Destination and Routing patterns to measure tourism and plan detours, bus routes, or new EV charger locations
- Annual Average Daily Traffic (AADT) counts to anticipate the need for repairs and inform safety planning
- Bike and pedestrian activity to figure out where to install bike lanes, implement traffic calming measures, or add crosswalks
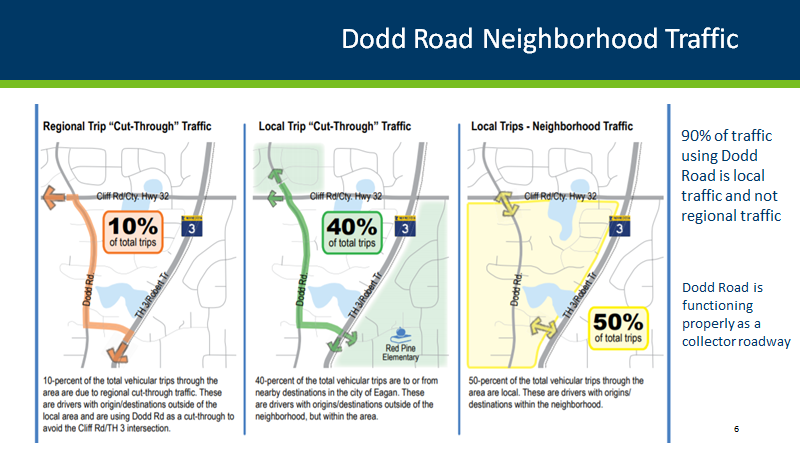
- Truck activity and routing data to move goods efficiently, highlight emissions hotspots, or reduce dangerous cut-through traffic in residential areas
Real-World Examples of Smart City Transportation Projects
Cities across the globe are using transportation data to make smarter decisions. Here are just a few examples of smart city transportation projects in the U.S. and Canada.
Temecula Retimes Traffic Signals
After securing safety funds for new smart signals, Temecula, California needed intersection data to understand which signals were most in need of synchronization.
They used StreetLight’s turning movement counts to diagnose congestion across 40 intersections within a few hours, saving at least three months on data collection and analysis, and deploying funds effectively to optimize signal timing.
Vancouver Makes the Case for Bus Infrastructure
Multimodal transportation options help reduce congestion, improve climate impact, and ensure equitable access to essential goods and services. But with many transit agencies facing exceptionally tight budgets, proving the value of bus infrastructure investments is crucial to getting improvements implemented.
In Vancouver, city analysts used big data to reveal that bus mode share was much higher than previously understood, helping them gain political buy-in for new bus lanes and rapid lines to provide commuters accessible alternatives to personal vehicle use.
Richmond Measures Equitable Access to Multimodal Transportation
Transportation equity is gaining more attention, with grant programs like Reconnecting Communities and Safe Streets and Roads for All incentivizing projects that expand equitable access. But getting reliable measurements of transportation access is often a barrier to diagnosing and addressing existing inequities impacting city residents, especially among communities of color, low-income households, and people with disabilities.
In the video below, Alex Bell of Renaissance Planning explains how data from StreetLight helped city planners for Richmond, Virginia develop measures of multimodal accessibility and understand who was most underserved by existing infrastructure. This analysis revealed where infrastructure investments were most critical to improve transportation equity throughout the city.
To learn more about how big data transportation analytics can make your city smarter, download our free eBook, Any Road, Any Mode: Your Guide to the Transportation Data Revolution.

Try out big data for transportation with a free trial.
Request your Free TrialReady to dive deeper and join the conversation?
Explore the resources listed above and don’t hesitate to reach out if you have any questions. We’re committed to fostering a collaborative community of transportation professionals dedicated to building a better future for our cities and communities.