Emissions of greenhouse gases (GHGs) and other pollutants are a pressing concern for environmental and human health. Despite recent declines in the U.S., the global level of emissions remains at historic levels, leading to alarm among public health advocates and climate change activists alike. [1]
Although there are many factors behind these historically high emissions levels, none is as significant as transportation. In the U.S., the transportation sector accounts for 29% of all GHG emissions, ahead of even electricity generation and industry. [2] These emissions are highly concentrated in urban areas. According to the United Nations, 60% of GHGs come from cities, where cars and other modes of transportation relying on Internal Combustion Engines (ICE) are especially prominent. [3]
This makes urban transportation a strategic target for reducing emissions and curbing their impact on the environment and public health. The good news is that more than 10,000 cities have already committed to reducing carbon emissions by 2050. [4] Still, if history is any indication, curbing transportation emissions is easier said than done. Ultimately, city planners, transportation agencies, and many other stakeholders must come together with a strategic plan.
What will it take to reduce emissions from transportation, and just how important is this task? In this article, we’ll explore:
The cost of urban emissions
Shifting the urban transportation paradigm
Picturing the future with big data
The Cost of Urban Emission
Emissions are more than a nuisance — they exact a heavy toll on the global economy. In the U.S. alone, pollution accounts for around 5% of the nation’s gross domestic product in damages each year, or $1.3 trillion in 2023. More than mere dollars and cents, however, the costs of pollution are particularly prominent in terms of public and environmental health. [5]
Damaging Public Health
By any estimation, pollution is a serious public health concern. According to one in-depth study, fine particulate matter from numerous toxic pollutants contributes to between 100,000 and 200,000 deaths in the U.S. each year. The transportation sector is responsible for the second-largest number of these deaths, behind only industrial and commercial activity. [6]
No matter who is involved, such a large number of deaths is tragic. Yet, the tragedy is made worse by inequity, as pollution disproportionately impacts already vulnerable Americans. Children, pregnant people, older adults, people of color, and those living in poverty are among those most at risk for adverse outcomes from pollution. [7]
Transportation emissions are a primary source of city smog impacting residents’ health.
Accelerated Climate Change
GHG emissions are the single largest contributor to climate change since the mid-20th century. [8] Research has connected emissions from human activity to a host of environmental events, including temperature extremes, surges in precipitation, more frequent droughts and wildfires, and more devastating weather patterns.
The risk of these events continues to grow, and the Intergovernmental Panel on Climate Change (IPCC) warns of serious peril for major ecosystems if global temperatures aren’t brought under control. If global averages reach temperatures of at least 1.5 degrees Celsius above pre-industrial levels, the effect on human, plant, and animal life may be irreversible, even catastrophic. [9]
Shifting the Urban Transportation Paradigm
In light of such devastating consequences, reducing carbon emissions is becoming a top priority for many involved in public policy and planning. Urban transportation represents an important target for these changes, as small adjustments in this sector could have an outsized impact on reducing pollution.
Realizing these outcomes requires three critical shifts in how we approach transportation in urban areas.
Move People First, Not Cars
The first and most important step in reducing urban transportation emissions is to shift away from a car-centric approach to transportation planning. The purpose of any type of transportation is to move people from one place to another, but many of our cities focus on moving cars.
Instead of merely building more and wider roads designed only for vehicles, planners can focus on building complete streets — ones that make room for all kinds of commuters, including pedestrians, bikers, and users of public transit. Centering multimodal transportation will help incentivize and enable more commuters to use these alternative methods.
Reducing reliance on household vehicles could have a substantial effect on urban emissions. According to the United Nations, each person who switches from cars to public transport could reduce their carbon emissions by up to 2.2 tons per year. [10] Another study shows that while public transit cuts GHG emissions by 58% compared to cars, cycling lowers them by 98% — meaning both offer substantial emissions reduction potential. [11]
The more transportation planners can leverage detailed data to inform their plans for new or updated roads, the more effective these changes can be. For instance, planners in Oregon’s largest special park district, the Tualatin Hills Park & Recreation District, were able to use detailed origin-destination data to confirm the value and potential impact of installing a bike-pedestrian bridge to move more commuters over a busy highway — without adding more car traffic.
See what emissions reduction tactics your city needs most
Although it’s possible to reduce emissions and other urban transportation problems by shifting the focus away from vehicles, it’s not feasible to entirely eliminate the need for cars in our cities. Where they are still needed, then, it’s critical to accelerate the move toward electric vehicles (EVs) and away from gas-powered vehicles.
One recent study showed that adopting EVs would reduce carbon emissions significantly in every state. In states like Washington or Vermont, which already rely on clean electricity sources, EV usage could reduce pollution from carbon emissions by more than 90%. Even in states like Kentucky and West Virginia, where electricity generation relies heavily on fossil fuels, emissions would drop by over 30% with a full transition to EVs. [12]
With more federal support for the EV initiative than ever, now is an ideal time for cities to encourage drivers to increase fuel efficiency and electrify their driving. In addition to the National Electric Vehicle Infrastructure (NEVI) grant program introduced by the Bipartisan Infrastructure Law (BIL), massive federal tax credits are also available for EVs and chargers, and many cities and states are taking a step further by providing credits of their own or encouraging utility companies to create rebate programs and other incentives. Cities themselves can also leverage such programs to expand public charging installations and electrify public transit.
Public EV chargers in cities help overcome barriers to accelerated EV adoption.
Rethink City Planning
As essential as investments in electrification and multimodal transportation are to reducing carbon emissions, they aren’t sufficient solutions to the problem. Urban planners must think bigger, considering land use, transportation, operations, policy, and more in a comprehensive approach to emissions-reducing city planning.
With a holistic view, city planners can make progress by focusing on initiatives such as investing in green buildings, expanding renewable energy production, and improving waste management. [13] They can also consider the best ways to invest in tomorrow’s transportation infrastructure.
This requires thoughtfulness and intentionality. The BIL provides historic levels of funding for cities to upgrade their transportation infrastructure, but studies show that these investments could actually lead to increased emissions if not used properly. For instance, the Georgetown Climate Center recommends that planners focus on a “fix it first approach” of maintaining existing roads and investing in public transit, EVs, and other low-carbon options — rather than building more roads or expanding existing ones, which could induce demand and bring more pollution. [14]
Again, choosing the right updates and planning initiatives requires access to extensive data, both in terms of transportation patterns and existing urban emissions levels. Only when properly informed can planners choose initiatives that will result in successful emissions reductions.
Picturing the Future With Big Data
At every turn in the fight against carbon emissions, data is critical for making informed, effective decisions. In transportation, planners must have access to a wide range of emissions-related metrics, such as:
Truck traffic by vehicle class (light-, medium-, and heavy-duty)
As urbanization continues to transform U.S. cities, this data has never been more critical for the decision-making process. Big data providers like StreetLight are helping to fill data gaps that would otherwise prevent planners from understanding their city’s impact on the climate. That’s how the Twin Cities Metropolitan Council was able to share critical emissions data with local governments, equipping them with crucial insights for local planning, rather than generic national numbers.
The Southern Maine Planning and Development Commission took a similar approach, using big data to power urban planning that reduces emissions. In the video below, see how they measured statewide VMT to develop regional mitigation strategies.
Stanford. “Global carbon emissions from fossil fuels reached record high in 2023.” https://sustainability.stanford.edu/news/global-carbon-emissions-fossil-fuels-reached-record-high-2023
United States Environmental Protection Agency. “Fast Facts on Transportation Greenhouse Gas Emissions.” https://www.epa.gov/greenvehicles/fast-facts-transportation-greenhouse-gas-emissions
United Nations. “Generating power.” https://www.un.org/en/climatechange/climate-solutions/cities-pollution
United Nations. “Seven Ways Cities Can Take Climate Action.” https://unfccc.int/news/seven-ways-cities-can-take-climate-action#
Standford. “How much does air pollution cost the U.S.?” https://sustainability.stanford.edu/news/how-much-does-air-pollution-cost-us
Environmental Science and Technology Letters. “Reducing Mortality from Air Pollution in the United States by Targeting Specific Emission Sources.” https://pubs.acs.org/doi/10.1021/acs.estlett.0c00424
American Lung Association. “Who is Most Affected by Outdoor Air Pollution?” https://www.lung.org/clean-air/outdoors/who-is-at-risk
United States Environmental Protection Agency. “Climate Change Indicators: Greenhouse Gases.” https://www.epa.gov/climate-indicators/greenhouse-gases
Intergovernmental Panel on Climate Change. “Climate Change 2022: Impacts, Adaptation and Vulnerability.” https://www.ipcc.ch/report/ar6/wg2/
United Nations. “Your guide to climate action: Transport.” https://www.un.org/en/actnow/transport
ScienceDirect. “The climate change mitigation effects of daily active travel in cities.” https://www.sciencedirect.com/science/article/pii/S1361920921000687
Yale Climate Connections. “Electric vehicles reduce carbon pollution in all U.S. states.” https://yaleclimateconnections.org/2023/09/electric-vehicles-reduce-carbon-pollution-in-all-u-s-states/
National League of Cities. “The Top 5 Ways Cities Are Addressing Climate Change.” https://www.nlc.org/article/2022/04/22/the-top-5-ways-cities-are-addressing-climate-change/
Georgetown Climate Center. “Issue Brief: Estimating the Greenhouse Gas Impact of Federal Infrastructure Investments in the IIJA.” https://www.georgetownclimate.org/articles/federal-infrastructure-investment-analysis.html
See how StreetLight's transportation analytics can help you improve mobility outcomes
Explore the resources listed above and don’t hesitate to reach out if you have any questions. We’re committed to fostering a collaborative community of transportation professionals dedicated to building a better future for our cities and communities.
Electric vehicles (EVs) are a critical element of the fight against climate change. Compared to a typical gas-powered vehicle, the average EV produces less than half the amount of carbon pollution over its lifetime. [1] Even at today’s moderate levels of EV sales, electric cars are already reducing crude oil usage by 1.7 million barrels a day. [2]
Yet we have a long way to go to reach the tipping point, when EVs take over as the primary form of individual transportation. In the U.S., 10% of new vehicles registered in 2023 were electric, far from a majority. [3] Tipping the scales requires not only an increase in EV production, but a significant expansion of the nation’s EV charging infrastructure.
As of today, our systems are woefully underprepared for an EV-dominant future. What will it take to catch up? Although federal and state-level funding is essential, building an adequate charging infrastructure largely comes down to smart, data-driven planning.
In this article, we’ll explore what that looks like, covering the following:
How do EV charging stations work?
The current state of EV charging infrastructure
Optimizing charger placement in communities
Promoting sustainable energy sources
How Do EV Charging Stations Work?
Electric vehicle supply equipment (EVSE), as charging stations are commonly called, is fundamentally different from gas pumps. While both types of equipment are designed to refuel vehicles, EV charging stations are far less standardized than gas pumps.
EVSE comes in several different types, from basic (extremely slow) Level 1 chargers to high-speed, Level 3 DC fast chargers. Although the latter can recharge an empty car battery to 80% in less than an hour, most public EVSE consists of Level 2 chargers, which take anywhere from four to 10 hours to achieve a similar charge level. [4]
Not surprisingly, EV charging station costs vary widely based on type. You can plug into your home outlet for Level 1 charging, but it’ll cost anywhere from $1,000 for a basic home Level 2 charger to upwards of $50,000 for a commercial Level 3 charger. [5], [6]
Besides the cost of EV charging stations, planners must consider numerous other factors, including the connection type, interoperability with various vehicles, and the payment network of choice. All of these are critical factors in how to build EV charging station infrastructure.
The Current State of EV Infrastructure
In the U.S., the number of public and private EV charging stations has grown rapidly in recent years, thanks largely to available tax credits and incentives to help reduce upfront costs. However, the nation’s EV charging infrastructure has a long way to go to keep pace with near-term goals for vehicle electrification.
That’s especially true for public EVSE. Recent research by Stanford University sounded the alarm that relying on nighttime, home-based charging would put far too much demand on the electrical grid within the next decade. [7]
Currently, there are almost 10 times more home EV chargers than public ones, and that ratio needs to change quickly. [8] Data from the National Renewable Energy Laboratory (NREL) further supports the need for a massive uptick in public charging station installations. As of 2023, there were just over 168,000 public charging ports available in the U.S., but NREL research calls for nearly 1.2 million public ports to match EV demand by 2030.[9], [10]
A screenshot from StreetLight’s EV Dashboard visualizes the largest EV charging infrastructure gaps across Massachusetts, based on vehicle activity and existing charger locations.
It’s not just a numbers game, either. If electric vehicles are to become the norm, EV charging station infrastructure must be more accessible to everyone. That means charging equipment must become more interoperable with all types of EVs, stations must be available where people can conveniently use them, and EVSE must be reliable and easy to use.
Overall, reaching this level of accessibility requires more investment in both public and private (workplace) charging, along with a commitment to eradicating “charging deserts” in underserved communities. [11]
See what emissions reduction tactics your city needs most
The long-term goal may be accessible, reliable charging for everyone, but we are still many miles from that final destination. Accelerating our progress in the right direction requires near-term prioritization. Where does a given community need EV charging infrastructure next? What locations would make it practical and easy for more existing EV drivers to switch from charging at home overnight to charging at work or while shopping during the day?
To understand that, planners must gather and analyze a host of data. Targeting the ideal location for more EV chargers involves analyzing demographics and demand, accessibility concerns, and mobility patterns in various communities. It also requires an understanding of existing infrastructure and the differing needs of rural and urban locations.
For instance, planners in a dense urban area may need to evaluate traffic patterns in numerous parts of the city to understand how far people commute every day, where they tend to stop and for how long, and where people without driveways tend to park. In a rural area, conversely, data about long-range commutes and the most trafficked freeway corridors may be more relevant. They might also examine data about interstate corridors with heavy commercial freight transit to find ideal hubs for charging heavy-duty vehicles.
In the Silcon Valley, for example, planners used StreetLight InSight® to evaluate Origin-Destination (O-D) data, traveler demographics, and more to help choose locations for 400+ public EV chargers.
Planners must also attack the problem at a broader level, considering factors like how a specific location for EV charging stations will affect electricity demand in a particular area.
To prepare the electric grid for rising EV charging demand, Eversource, New England’s largest utility, used StreetLight to forecast where and when charging demand would be highest to plan substation upgrades and charging rates that would incentivize off-peak charging. Their demand analysis also allowed them to coordinate long-term electrification planning with public agencies.
Promoting Sustainable Energy Sources
Taking a wider scope, examining the best locations to maximize the impact of clean transportation can help planners prioritize where and how to build EV charging infrastructure. Although EVs reduce emissions regardless of where you deploy them, they offer the largest reduction in regions that rely on clean energy sources like wind, solar, or hydroelectric power.
For example, driving an EV in a coal-dependent state like West Virginia results in a 50% reduction in emissions compared to driving a gas car. In Texas, which is a national leader in solar and wind power generation, choosing an EV reduces emissions by over 77%. [12]
Practically, the application here is twofold: On one hand, it may be beneficial to develop more EV charging infrastructure in areas that already rely on clean energy sources. Yet, it’s also likely worth considering policies and incentive programs that will help municipalities and private companies go beyond simply installing EVSE to adding solar panels, wind turbines, or other clean energy sources that increase EVs’ environmental impact.
Get Charged Up With Big Data
EV charging infrastructure has come a long way in the U.S.—but there’s still a long road ahead to add enough EVSE to support a truly all-electric transportation system. Reliable data is crucial at this stage, regardless of where you’re looking to add more charging equipment. The pressing issue doesn’t simply come down to adding more chargers, but knowing where to put them so that they best serve real-world demand efficiently and equitably.
With purpose-built EV metrics and emissions analytics, StreetLight InSight® can help planners, policymakers, and businesses make smart decisions in this crucial sector. This software unlocks access to relevant transportation data, including O-D, vehicle miles traveled, traveler demographics, travel times, and more. This helps pinpoint where people are traveling and when traffic is highest to measure the potential GHG impact of adding EV charging stations to any specific location, while ensuring the grid can handle rising electric demand.
To start using StreetLight to plan your EV charging infrastructure today, contact us here.
Yale Climate Connections. “Don’t get fooled: Electric vehicles really are better for the climate.”
BloombergnNEF. “ElectricVehicle Outlook 2024.”
International Energy Agency. “Global EV Outlook 2024: Trends in electric cars.”
U.S. Department of Transportation. “Charger Types and Speeds.”
J.D. Power. “What Does an EV Home Charger Cost?”
State of New York. “Exhibit I Cost of charging stations.”
Stanford University. “Charging cars at home at night is not the way to go, Stanford study finds.”
International Energy Agency. “Global Outlook 2024: Trends in electric vehicle charging.”
National Renewable Energy Laboratory. “The 2030 NationalCharging Network: Estimating U.S. Light-Duty Demand for Electric Vehicle Charging Infrastructure.”
Alternative Fuels Data Center. ”U.S. Public Electric Vehicle Charging Infrastructure.”
World Resources Institute. “Many US Communities Face EV ‘Charging Deserts.’ 5 Strategies Can Help.”
Alternative Fuels Data Center. “Emissions from Electric Vehicles.”
Explore the resources listed above and don’t hesitate to reach out if you have any questions. We’re committed to fostering a collaborative community of transportation professionals dedicated to building a better future for our cities and communities.
Urban transportation will undergo significant change in the foreseeable future due to the increasing emphasis on sustainability, tech advances like autonomous and electric vehicles, and a general shift toward integrated mobility solutions. These changes will present both challenges and opportunities to agency stakeholders, large and small businesses, and city dwellers alike.
What could public transport look like in the future, and how will we deal with issues like equity, safety, and the environment? What will happen as automated vehicles and urban air mobility enter the picture? What should government officials, entrepreneurs, and other stakeholders know about these various challenges and the future of urban transportation itself?
In this post, we’ll cover:
The Changing Needs of Urban Centers
What Is the Future of Transportation Systems?
Shifting Perspectives from Transportation to Mobility
Environmental Concerns and Decarbonization
New Modes of Mobility: AVs and UAM
Why Big Plans Require Big Data
The Changing Needs of Urban Centers
Urban centers are becoming more densely populated across the U.S. [1] As of 2020, urban areas had an average population density of 2,553 people per square mile, up from 2,343 in 2010. At the same time, urban expansion has led to a significant increase in private cars. This, in turn, has caused more congestion and higher emissions.
But congested roadways and rising emissions don’t have to be the inevitable results of higher population density. Many cities are taking steps to address these challenges with sustainable transportation planning that emphasizes shared mobility and other key strategies.
Some of the green urban transportation strategies now gaining popularity include:
Focusing on “open streets,” where roadways are temporarily closed to vehicle traffic and opened for public use to encourage walking, cycling, or community events.
Implementing congestion pricing to discourage vehicle use at busier times of day.
Creating a reliable network of electric vehicle (EV) chargers to make EVs a more convenient alternative to gas and diesel vehicles.
Building multimodal infrastructure to support active transportation and shared mobility modes like walking, biking, and public transit.
What Is the Future of Transportation Systems?
Transportation is responsible for more climate warming greenhouse gases in the U.S. than any other sector. [2] One study suggests that lowering emissions in the transportation sector alone could account for more than one-third of the 2030 U.S. climate target.3 This will encourage a focus on transportation systems that produce lower amounts of greenhouse gas and other pollutants, and the adoption of technologies like EVs, hybrid vehicles or alternative fuels.
Most U.S. cities are car-centric by design, with much of the population living in sprawling suburban neighborhoods where people must travel miles to reach key commercial centers for employment, school, goods, and essential services. This type of design disadvantages anyone who does not have access to a car, creating inequities. Investing in and expanding multimodal transportation can help solve this problem.
Public transit is a particularly powerful tool to address these inequities. With data on common traffic origins and destinations, planners can understand where bus routes would be most essential for commuting or accessing essential goods and services like groceries and medical care.
For example, SamTrans, a transit authority in the Bay Area, used traffic data to study how COVID had impacted bus ridership on key commuter routes. Their analysis revealed opportunities to optimize bus schedules, which led to a 30% boost in ridership.
How Will Public Transport Change in the Future?
New transportation solutions will be able to use technologies like advanced mobility platforms and autonomous vehicles. Planners could also consider rapid bus lines, better timetables, and more responsive schedules as a way to improve public transportation. New market entrants can leverage these innovations as they aim to eliminate barriers, enhance efficiency, and provide a seamless, user-friendly experience.
Crucially, decision-makers will also need to look for different funding methods as traditional gas tax revenues drop. Governments have long relied on revenues from the sale of gas and will need to find alternative solutions as gas-powered vehicles decline.
New systems also need careful planning to avoid an increase in congestion and minimize environmental impact. Planners will need to consider autonomous vehicles and mobility as a service solutions, as these technologies may eventually be cost-competitive alongside traditional urban mass transport services.
Shifting Perspectives from Transportation to Mobility
Transportation focuses on the logistics of moving vehicles, while mobility factors in accessibility, environmental sustainability, and user experience. For this reason, many advocates and practitioners within the transportation industry are calling for an increased emphasis on mobility as part of a people-oriented approach to urban planning.
Centering People: Equity in Urban Transportation
Equitable access to transportation is critical because it impacts access to housing, employment, health care, education, and other essential services. This means transportation systems can easily exacerbate existing inequities people experience based on their race, class, disability, and more, or they can become tools to mitigate these inequities.
For example, low-income communities that have greater access to jobs within a 15-minute drive have a higher upward economic mobility. Improvements to public transportation can help people who rely on this mode of travel for their employment needs. Currently, the average U.S. metropolitan resident can only access 30% of jobs in their region within a 90-minute journey. [4]
Some communities also suffer more than others when it comes to the burden of environmental hazards, including pollution from transportation. [5] Equitable urban transportation planning can mitigate these impacts and reduce the concentration of negative effects in specific areas — such as neighborhoods predominately inhabited by people of color.
Low-emission transportation modes like EVs, biking, and walking, as well as shared modes like public transit, can help cut overall transportation emissions and improve air quality in our cities. Access to safe and reliable transportation options such as cycling or walking can also contribute to general health. [6]
A Safer World for Bicycles and Pedestrians
Increasingly, planners are centering those outside of vehicles in transportation design conversations.
To create a safe world for bicyclists and pedestrians — often referred to by government entities as “vulnerable road users” — planners will need to focus on infrastructure improvements as well as policy initiatives and community engagement. For example, Complete Streets policies can help enable safe access for all road users, regardless of mode of transportation, age, or experience. [7]
Specifically, building safe cycling and pedestrian infrastructure often involves creating protected bike lanes and pedestrian paths along existing roadways to reduce conflicts with motorized traffic. Planners can also prioritize safety at intersections by adding pedestrian islands or countdown signals, increasing pedestrian crossing intervals, and adding bike-specific signal phases.
New Modes of Mobility: AVs and UAM
New modes of transportation are already here, and cities will need to wrestle with how to support and regulate these modes.
Autonomous Vehicles
As autonomous vehicles (AVs) become more popular, there will be significant implications for city development and transportation. Should these vehicles become widespread, this could have a big impact on transportation, urban design, land use, real estate, and safety. [9]
One such impact could include a significant reduction in the demand for parking and a drop in the number of vehicle miles traveled as people share transportation. Also, autonomous vehicles could improve first- and last-mile connections for individual travelers. While this may decrease the number of people who use conventional transit solutions, [10] it may also place additional pressure on transportation providers who could face additional revenue pressures as a consequence.
More widespread use of AVs could have implications when it comes to urbanization, as there may be less demand for land or services once set aside for “traditional” vehicles. Planners may need to redesign certain streets if there is less need for car parking, or develop new transportation nodes to support intermodal travel.
Get your Guide to the Transportation Data Revolution
To accommodate these new aircraft, governments will need to develop “vertiports” [11] and other infrastructure while addressing land-use planning, zoning regulations, or safety standards for these new solutions. These vehicles would share air space with traditional aircraft and ground space with conventional cars or AVs. Further, noise could be a significant factor for planners, and lawmakers will need to mitigate disturbance to residents while maintaining UAM operations.
How will transportation planners integrate UAM solutions with existing transportation modes? They may plan for seamless passenger transfers between these aerial vehicles and other transit modes, such as trains or buses.
While AVs and UAMs may still be on the horizon, planners should also understand that these new technologies could produce inherent risks, including problems around cybersecurity and privacy. For example, there are several known cybersecurity vulnerabilities in the UAM realm. [12]
More and more, transportation planners and engineers are supplementing these traditional methods with online, on-demand traffic data platforms, which use big data methods to deliver more information for more roads and more modes, for any time of the day or year.
For example, in the video below, a data scientist from the Metropolitan Council of the Twin Cities explains how they use big data to get actionable emissions measurements to help regional municipalities and transportation agencies drive down greenhouse gas (GHG) emissions.
For more resources to help you leverage big data for better mobility in your city, check out Any Road Any Mode: Guide to the Transportation Data Revolution.
Nation’s Urban and Rural Populations Shift Following 2020 Census https://www.census.gov/newsroom/press-releases/2022/urban-rural-populations.html
Carbon Pollution from Transportation. https://www.epa.gov/transportation-air-pollution-and-climate-change/carbon-pollution-transportation
An All in Pathway to 2030: U.S. Methane Emissions Reduction Potential https://www.americaisallin.com/all-pathway-2030-us-methane-emissions-reduction-potential
Delivering on Equity with Mobility Technologies. https://www2.deloitte.com/uk/en/insights/industry/public-sector/transportation-equity.html
Cycling and Walking Can Help Reduce Physical Inactivity and Air Pollution, Save Lives and Mitigate Climate Change. https://www.who.int/europe/news/item/07-06-2022-cycling-and-walking-can-help-reduce-physical-inactivity-and-air-pollution–save-lives-and-mitigate-climate-change
Adopting a Strong Complete Streets Policy. https://smartgrowthamerica.org/program/national-complete-streets-coalition/policy-atlas/policy-development/
Demand for Hydrogen Fuel Cell Buses Continues to Rise. https://cleantechnica.com/2023/11/13/demand-for-hydrogen-fuel-cell-buses-continues-to-rise/
Multilevel Impact of Emerging Technologies. https://bpb-us-e1.wpmucdn.com/blogs.uoregon.edu/dist/f/13615/files/2020/01/NSF-Report_All-Chapters_FINAL_013020.pdf
The Influence of Introducing Autonomous Vehicles on Conventional Transport Modes and Travel Time. https://www.mdpi.com/1996-1073/14/14/4163
Highflying: Vertiports and the Future of Urban Travel https://ww3.rics.org/uk/en/modus/built-environment/resilient-infrastructure/vertiports-urban-travel.html
A Review of Cyber Security Vulnerabilities for Urban Air Mobility. https://www.researchgate.net/publication/348244879_A_Review_on_Cybersecurity_Vulnerabilities_for_Urban_Air_Mobility
Expand mobility for your community with data-driven transportation planning
Explore the resources listed above and don’t hesitate to reach out if you have any questions. We’re committed to fostering a collaborative community of transportation professionals dedicated to building a better future for our cities and communities.
When we founded StreetLight Data back in 2011, our sole focus was to help educate and plan for electric vehicles (EVs). We quickly realized that our transportation data would have a more significant positive impact if we expanded our mission beyond EV data analytics. However, EVs are still one of my deep interests: I drove a Chevy Volt for several years before going car-free, and I focused on EVs in my early career at the Rocky Mountain Institute and Federal Energy Regulatory Commission.
Based on my personal experience, I know we can do a better job of planning and deploying EV charging infrastructure. If we want to see wide adoption of EVs and promote sustainable transportation networks, then we must make charging more convenient and affordable while minimizing its impact on our electrical grid.
Given the wave of new charging station deployments in the U.S. and abroad — and the funding now available for EV charging infrastructure through Bipartisan Infrastructure Law (BIL) programs like the National Electric Vehicle Infrastructure (NEVI) and Charging and Fueling Infrastructure (CFI) grants — now seems like the right time to explain how Big Data can help.
As transportation infrastructure planners, it’s important to recognize that most charging will be done at home. But convenient, cost-effective out-of-home charging is necessary to get the adoption levels we want from EVs. EV charging analytics derived from Big Data can support better out-of-home electric vehicle charging in four ways:
Site Selection – Macro: Scan an entire city to find the best places for EV charging.
Site Selection – Micro: Analyze and validate individual potential sites.
Education and Awareness: Select highly visible “activity centers” for chargers to maximize public exposure.
Right Sizing: Improve estimation of grid load and electrical cost (and ancillary grid service applications).
In this blog post, I will discuss each of these topics using EV charging analyses created in StreetLight InSight®. (That’s our online platform for transforming location records created by connected devices into travel pattern analytics.)
Site Selection – Macro: Scan an Entire City to Find the Best Places for EV Charging
Although most EV charging will be done at home, the well-documented phenomenon of “range anxiety” is slowing adoption. Using transportation analytics, we can scan an entire city or region to find the best places for EV chargers. On-demand EV data analytics allow us to define “best” in different ways, and easily run multiple scans at very low marginal cost and effort.
Here’s a quick video on how this works in the StreetLight InSight® platform:
For example, let’s say that I believe the best charging station locations will be the workplaces of people who:
Drive more than 40 miles a day (so they might want to recharge mid-day),
Live in neighborhoods that currently have high hybrid adoption, and
Go to the same workplace almost every weekday.
I can scan every block or property in a region to highlight where such early adopters tend to park. In Figure 1 below, you can see this scan on a 1-kilometer grid in the San Francisco Bay Area. However, I could also use StreetLight InSight® to scan for other key characteristics, for example:
Where people from a particular income bracket go when they’re not working or at home,
Where cars tend to be on longer drives when they still have 100 miles to go,
Where people who don’t have driveways tend to park.
Figure 1: A scan of the San Francisco Bay Area that highlights the work neighborhoods of people who drive more than 40 miles per day and currently live in high-hybrid adoption areas.
Identify the best EV charging locations with electric vehicle data
Site Selection – Micro: Analyze and Validate Individual Potential Sites
Sometimes, the question of EV charger location optimization is more constrained. Perhaps a retail brand has 200 locations, and wants to deploy EV chargers to 20 of them. Which 20 locations are the best? Using similar logic as described above, individual locations can be scored for certain characteristics of drivers at or near the location (see Figure 2 below).
Figure 2: A chart showing EV “scores” based on three criteria for a group of stores from the same brand.
This micro-site selection analysis can also be used to select amongst individual properties and locations within a single neighborhood that a macro-scan previously identified as a strong candidate (see Figure 3 below).
Figure 3: The highest scoring EV parcels within 500 meters of an off-ramp in Texas that a macro-scan previously identified as “high EV convenient.” Parcels shaded in red have the best scores for EV convenience.
Earn customer visits with EV charging data for your business locations
Simply being seen is one of the more important features of EV chargers. Chargers remind citizens of the availability of EVs, and they build confidence that charging will be easy and convenient. Analyzing for visibility can be a simple numbers game. We want to find out:
Which roadside areas are seen by the most people driving by?
Which parking lots are parked in most often?
Transportation analytics can help answer both of these questions. In Figure 4, Retail Group C’s parking lot has more parking events than A or B. From a visibility perspective, it may be the best bet, though not necessarily from a charging load perspective.
Right Sizing and Better Estimation of Grid Load
The distribution of the time of day during which charging occurs can make a big difference in terms of the number of chargers needed (and thus the installation cost), the load on the grid, and the costs associated with charging. Depending on the locality, EV charging rates can vary by time of day. For businesses and commercial properties that face costs based on demand, charging can also trigger extra fees from their utility company.
Thus, knowing the time of day when EVs are likely to be charging is critical for estimating installation and operating costs. In addition, time of day information is necessary for anyone exploring more integrated vehicle-to-grid ideas. Figure 4 shows a parking load curve for three similarly-sized commercial parking lots in Texas that are located within one-half mile of each other along the same road. These are their key characteristics:
Lot A contains a movie theater and restaurants,
Lot B contains one very large big box retailer, and
Lot C contains a group of four big box retailers.
Figure 4: This graph shows the parking load for three different commercial lots in Texas during a 24-hour period.
While Lot C has the most visitors per day, they peak during the midday and afternoon time periods. In many localities, especially those with hot climates, utility companies charge the highest rates during midday and afternoon. While Lot A has fewer total people, it peaks in the evening. At the same time, such a peaky load may mean that a lot of people want to charge at once, making it necessary to install a few more stations.
Depending on local rate structure and demand charging schemes, the cost of installing chargers at these three parking lots can vary widely, even though they are located close to one another and have similar profiles. Using “generic” load curves won’t reveal this variation – only working with comprehensive and flexible EV charging analytics can.
For more information on StreetLight’s electric vehicle data analytics for charger site selection, emissions measurement, and more, check out our EV charging data solutions.
Identify the best EV charging locations with electric vehicle data
Explore the resources listed above and don’t hesitate to reach out if you have any questions. We’re committed to fostering a collaborative community of transportation professionals dedicated to building a better future for our cities and communities.
What Traditional GHG Measurement Is Missing: 4 ways to reveal the full picture on emissions
What Traditional GHG Measurement Is Missing: 4 ways to reveal the full picture on emissions
To effectively reduce transportation GHGs, agencies and consultants need granular, actionable data that go beyond broad VMT numbers. StreetLight’s new GHG Emissions metrics — covering trucks, trip starts, EVs, and more — help them zero in.
With national and state governments working to decarbonize transportation, meeting steep emissions reduction goals requires accurate, local greenhouse gas (GHG) measurement. To effectively reduce emissions, establishing a baseline, identifying mitigation strategies, and measuring impact year-over-year is critical.
But quantifying GHG emissions for a city, county, or state isn’t as simple as calculating total Vehicle Miles Traveled (VMT) for the region. Nor is VMT measurement in isolation a particularly helpful tool for identifying reduction opportunities. Many factors, such as commercial vs. personal vehicle breakdown, trip origins and destinations, and the impact of EVs, influence total emissions and which reduction strategies will be most effective.
In our article How to Measure Greenhouse Gas Emissions From Transportation, we explain some of the key metrics behind accurate, local GHG measurement like VMT, Vehicle Hours of Delay (VHD), trip speed, and trip duration. Here, we’ll explore three data-driven analyses available within StreetLight’s new GHG Emissions metrics that agencies can use to develop impactful and ongoing decarbonization strategies.
Focus on GHG Emissions You Can Influence
When measuring GHG emissions, analysts typically start by calculating the total distance traveled in the area (VMT or VKT). This number is then multiplied by the amount of fuel required to power that travel, based on average fuel economy for the relevant vehicles in the area. Using standard emissions rates, the total gallons of fuel can then be converted into metric tons of GHG emissions, giving the total GHG emissions for the area.
These calculations can help establish useful estimates, but lumping all these individual trips together doesn’t tell the whole story.
To implement and evaluate effective decarbonization strategies for an individual city, county, or state, it’s important to understand what types of trips will actually be impacted by various emissions reduction efforts. For example, if a county has a major interstate running through it that brings in traffic from other regions, county-level emissions reduction efforts are unlikely to impact emissions incurred on that highway, since the traffic originates outside the scope of their jurisdiction.
These types of observations can inform how planners and policymakers tackle decarbonization in their region. For example, establishing a state-wide EV tax credit to encourage electric vehicle adoption will only impact emissions for trips that originate in the state — this tax incentive won’t impact the likelihood that trips originating in other states are taken in zero-emission vehicles (ZEV). In this case, states would need to work with one another to reduce inter-state emissions.
To gain clarity on the influence of different decarbonization strategies, understanding trip origins and destinations is key.
To put it simply, trips can either originate within a given region (such as a city, county, or state) or outside that region. Likewise, trips can either end within or outside of a given region. This creates four basic trip categories:
Internal/External (i.e., trips that begin inside the region and end outside of it)
External/Internal (beginning outside and ending inside)
Internal/Internal (both beginning and ending inside the region)
Passthrough (AKA External/External, beginning and ending outside the region).
Left: Many GHG calculations are based on VMT from all trips, without accounting for origins or destinations. Right: Segmenting trips based on origins and destinations either internal or external to the region results in four distinct trip types that can each be influenced by different decarbonization strategies.
Segmenting trips into these four types can help jurisdictions quantify the vehicle-based emissions under their control and implement GHG reduction strategies targeted at these trips. It can also help influence conversations across regional governments as they begin to coordinate efforts to better solve emissions at a larger scale.
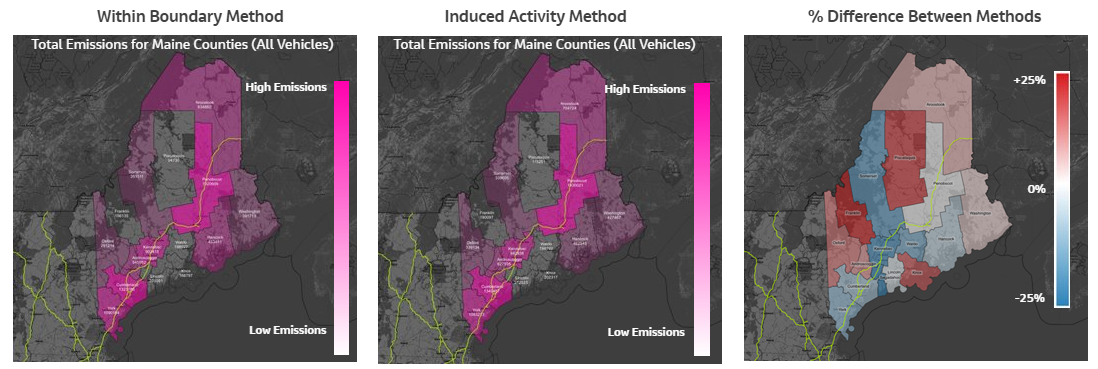
When measuring greenhouse gas emissions for a given area using StreetLight’s metrics, agencies and consultants can use various methodologies that treat each of these four trip categories differently. A common standard is the Global Protocol for Community-Scale Greenhouse Gas Emissions Inventories (GPC) method, which we’ll call the Induced Activity Method. This method was designed to help cities focus on emissions resulting from “city-induced activity,” but other methods may be more useful depending on the jurisdiction and its goals.
One advantage of the Induced Activity Method is that it helps jurisdictions account for emissions resulting from induced demand (i.e., emissions from EI trips where their region is the attractor, such as when tourists travel to a state park or an event venue draws traffic from out of town). But a “Within Boundary Method” that only counts VMT occurring within the jurisdiction can be useful to agencies and consultants looking to understand how internal policy or infrastructure may impact local GHG emissions.
StreetLight’s GHG Emissions Metrics allow agencies and consultants to choose the emissions allocation methodology that suits their goals — either the Within Boundary Method or the Induced Activity Method — to ensure a reliable baseline GHG emissions number.
In the above example, StreetLight measures county-by-county emissions in Maine using these two different methodologies, and visualize the difference between the two methods in the map on the right. Looking at these methodologies side-by-side, several notable insights emerge:
Kennebec and Sagadahoc counties have lower emissions — 7% and 25% lower, respectively — when using the Induced Activity Method because they have more pass-through traffic on major highways that may be outside local county influence, but important to statewide planners.
Knox, Franklin, and Piscataquis counties have higher emissions — 21%, 22%, and 22% higher, respectively — when using the Induced Activity Method because they have a significant amount of VMT from transboundary trips that start or end in these counties.
Counties with a large positive change (red) are typically counties that are the origin or destination of long trans-county (EI or IE) trips because they:
Attract traffic from elsewhere in the region
Are home to communities that need to travel to other regions to access services or employment
And/or don’t have much passthrough traffic
Counties with a large negative change (blue) are typically counties that see a lot of passthrough traffic relative to total traffic. These are often counties with major highways.
These differences shed light on why different jurisdictions might want to understand baseline GHG according to these two methodologies, such as differing amounts of commuter traffic, induced demand, or highway traffic passing through the region. Whichever methodology an agency chooses for a given analysis, the ability to segment trips based on origin and destination data is key.
Zero in on Emissions Hotspots
Most emissions measurements are calculated at the regional level for an entire state, county, or city. But zeroing in on specific roads and even segments of roads can help pinpoint major sources of emissions that could be solved with targeted infrastructure or policy changes.
In the example below, we measure emissions at the road segment level for Marin County, CA, in the Bay Area, revealing an emissions hotspot on Richmond Bridge that is a major route between the East Bay and Marin County.
StreetLight’s GHG Emissions Metrics show segment-level emissions on highways in Marin County, CA. A high-emissions segment shows up in yellow on Richmond Bridge, revealing the emissions impact of this traffic bottleneck.
Emissions are lower on either side of the bridge, where vehicles can disperse, but as traffic becomes congested over the bridge, this segment generates an outsized impact on local emissions.
When agencies and consultants have access to segment-level insights like these, they can develop targeted mitigation strategies that supplement broader initiatives like electrification planning or active transportation projects. For Marin County, reducing congestion on Richmond Bridge could alleviate a significant contributor to jurisdictional emissions.
Measure Emissions Reduction from Electric Vehicles and Hybrid Vehicles
Encouraging the adoption of electric vehicles (EVs) and Plug-in Hybrid Electric Vehicles (PHEVs) is central to many national, state, and city decarbonization plans. Quantifying the total avoided tailpipe emissions from these vehicles can help agencies win funding and gain public support for electrification initiatives, giving them more traction and amplifying their impact.
StreetLight’s GHG Emissions Metrics allow agencies and consultants to view avoided tailpipe emissions based on VMT and market penetration rates for EVs and PHEVs in a given area.
In Maine, for example, StreetLight’s GHG Emissions Metrics show York, Cumberland, and Penobscot counties see the biggest reductions from EV penetration, most likely because they contain population centers such as Portland and Bangor. Cumberland County avoided 13,196 mt CO₂-eq in 2022 due to relatively high VMT and market penetration of EVs and plug-in electric hybrids (PHEVs). Penobscot County, on the other hand, had very similar VMT to York County (2.87B compared to 2.66B), but Penobscot avoided only 4,122 mt of CO₂-eq due to lower EV and PHEV penetration. Penobscot’s EV penetration rate is just a third of that in York County.
The advantages of electrification may seem obvious, but quantifying the positive impact of EVs and PHEVs over time can speed the path to net zero goals by making these advantages concrete and persuasive. Agencies can use these analyses to win federal funding for new charging stations or electric bus fleets, encourage the public to use EVs, or foster public-private partnerships with electric utilities and charging station manufacturers.
Measuring the impact of EVs over time is also key for public agencies to understand how far they’ve progressed toward decarbonization goals and course correct if the pace of change is falling behind.
Distinguish Between Personal Vehicle and Commercial Vehicle Emissions
Although light-duty cars and trucks account for 87% of all vehicle miles traveled in the U.S.,1 they contributed just 58% of the greenhouse gas emissions from transportation in 2021. By contrast, medium- and heavy-duty trucks accounted for 23% of GHG emissions, beating out aircraft, rail, and other forms of transportation and generating an outsized impact on atmospheric carbon levels.2
That means in order to accurately measure GHGs from local transportation, it’s important to understand how many vehicle miles traveled are generated by light-duty vehicles vs. medium- and heavy-duty vehicles. Likewise, segmenting GHG emissions by vehicle weight helps agencies identify where decarbonization strategies specifically targeting commercial vehicles — such as policies and programs that encourage private and public fleet electrification — may be impactful.
StreetLight’s GHG Emissions Metrics show the proportion of total emissions produced by light-, medium-, and heavy-duty vehicles for counties in Maine.
For example, in Maine, a county-by-county breakdown of emissions share by vehicle type reveals a few key insights:
Throughout Maine, light-duty traffic generates the bulk of emissions.
Somerset (13.7%), Penobscot (13.2%), and Androscoggin (12.5%) have the highest shares of emissions from heavy-duty traffic out of the 14 counties studied.
In Cumberland (9.6%) and Oxford (9.3%) counties, medium-duty vehicles contribute roughly 9% of total vehicle emissions, the highest rates among the 14 counties studied.
For more information on turning GHG measurements into effective decarbonization strategies, download our Transportation Climate Data Guide.
To learn more about StreetLight’s GHG Emissions Metrics, with regional and segment-level granularity, emissions avoided metrics, and personal vs. commercial vehicle impacts, check out our Transportation Climate Solutions.
1. Center for Sustainable Systems, University of Michigan. 2022. “Personal Transportation Factsheet.” Pub. No. CSS01-07. 2. United State Environmental Protection Agency. “Fast Facts on Transportation Greenhouse Gas Emissions.” June 13, 2023.
EVs, Decarbonization, & Equity Are Front-and-Center At TRB 2023
EVs, Decarbonization, & Equity Are Front-and-Center At TRB 2023
This year’s Transportation Research Board (TRB) was the first gathering since funds began rolling out in earnest from the Bipartisan Infrastructure Law (BIL). With the pandemic disruption to travel patterns and BIL funding in the background, conference attendees and panel sessions kept coming back to key themes throughout the conference — decarbonization and equity.
As Secretary Buttigieg said in his keynote address,
“Research and innovation will play an exceptionally important role in the decade ahead for transportation.”
But he and others were quick to acknowledge that the challenges transportation professionals faced were in many ways bigger than ever.
While panels and posters covered myriad topics, key themes emerged that will shape the year ahead in transportation planning and research.
We dive into the big topics in our TRB recap webinar. Watch it here.
It’s not about getting people from A to B as fast as possible anymore
It’s hard to say when it happened but there is no question that the transportation industry’s role has expanded. Questions of land use, economic development, safety, resilience, and climate impact all intersect with the transportation industry and must now be considered in tandem with any planning decisions.
As such the way we study our roadways and corridors is completely different from how it used to be — it’s no longer about counting cars at intersections during rush hour. Now we need to take an expansive look at the comprehensive uses and needs of the people using our networks. Even studying who is not using these roadways and why — raising questions of equity and segregation — are central to transportation decisions.
On the one hand, the data available to enact this work has never been more plentiful. But it also requires coming to thorny transportation questions with a set of hypotheses, and being willing to challenge those hypotheses with empirical evidence.
Transportation planners no longer have to work based on a set of assumptions about when people travel and why. Nor could they, given the way the pandemic has utterly disrupted travel patterns. But this also means that they are faced with many ways of looking at a problem. Significant analytical skills will be needed, and even a dose of humility, to ensure that agencies are identifying the biggest problem and then right-sizing the solution to that problem.
Decarbonization is not a buzz word
The centrality of decarbonization was threaded throughout much of TRB. We’ve heard it many times by now — transportation is the single biggest contributor to greenhouse gas emissions. Now BIL funding has put EVs front-and-center as the lever that could help pull transportation emissions downward by putting significant resources behind charger installation. In addition, more incentives for EV purchases could further speed adoption.
To that end, StreetLight’s introduction of EV mode at the conference can help agencies learn and adapt to how EV driver behavior may differ from gas-powered driver behavior, whether current EV chargers are being installed where they’re needed, and whether there are gaps in how roadway networks support EV drivers.
Transportation professionals have other means of pursuing decarbonization beyond facilitating the EV transition, especially by investing in multimodal infrastructure. Here the subject of coordination across local and regional agencies came up often — and remembering that safety, in all its forms, is the most important responsibility of transportation agencies — not speed.
Equity must be threaded into every aspect of transportation
From procurement to infrastructure investment, equity is not a second order function for transportation professionals. As agencies look to unlock infrastructure funding, it’s clear that the equity impact will be central to the success of grant applicants. Data will be essential to making that case for how investments support equity goals, or redress long-standing disparities.
Agencies are tasked with “gathering the data to make the case on ways for transportation policy to be a powerful tool in the service of fairness and equity,” said Secretary Buttigieg.
From EVs To Retail, Traffic & Mobility Data Is Rewriting How The Private Sector Operates
From EVs To Retail, Traffic u0026 Mobility Data Is Rewriting How The Private Sector Operates
Andrew Thompson Interviewed by Martin Morzynski
Mobility data has already changed how city planners reimagine our public spaces. Now, private companies are leveraging that same data and applying it across a spectrum of commercial uses — from installing EV chargers at retail stores to identifying the next real estate build at a transportation crossroads.
We asked Andrew Thompson, Solution Engineer for the Commercial Sector at StreetLight, to talk to us about how cities and commercial enterprises are embracing traffic and mobility data and what’s still standing in the way of environment-focused initiatives like EV. Here’s what he had to say.
You’ve worked across the spectrum of data and services for the past decade. Why are traffic and mobility data such game-changers?
Human mobility is a major factor in economic and infrastructure planning. Until the proliferation of big data, it was very difficult to measure the movement of people at a macro level. Today mobility big data has become an indispensable ingredient across a number of commercial segments such as:
Understanding the demand for new mobility modes, such as Autonomous vehicles (AV) or Urban Air Mobility (UAM)
Monitoring demand within the automotive supply chain
In fact, new mobility wouldn’t be possible without big data.
What was the aha moment at Streetlight when it became clear how valuable transport metrics could be for new mobility businesses beyond the government sector?
As a variety of new mobility trends emerged over the past several years, we learned that most of what StreetLight already offers to the public transportation agencies is also applicable in the private sector — and at a much larger scale. The big differentiator is that public agencies are concerned with the transportation metrics within their jurisdictions. Private sector companies are concerned with the same metrics nationwide.There’s an all-hands-on-deck effort to make sure that as we expand transportation networks, we’re creating solutions that decrease emissions. How do you see Streetlight helping mobility businesses build a sustainable transportation network?
Improvement to any system is only possible if we can accurately measure baseline conditions and periodic changes. StreetLight provides the unique ability to accurately measure and monitor multimodal traffic at a very granular level. Further, it provides actionable insights about how to bring efficiencies to the system. You can’t create an efficient, sustainable mobility infrastructure if you don’t understand how people move now and anticipate how they will adapt to expanded mobility options.
We’ve seen a massive expansion in the modes and approaches to transport available in the past 5 years, from ride-sharing to micomobility to mainstream electrification to software enablement. What has surprised you most in this transition?
Many new technologies have been around for a long time but did not enjoy widespread adoption because they lacked a compelling catalyst. Of all the emerging mobility trends, EVs have made the sharpest upward trend in recent years, helped not only by the shift away from combustion engines but also the emergence of UAM and AVs.
EV is one of those technologies that – after being dormant at the sidelines for decades – has suddenly leaped ahead. They’ve benefited from government regulatory policies, reduction in cost, and a cultural shift toward sustainable living. It really has created a “perfect storm” that has resulted in a sharp uplift in demand for EV infrastructure.
“The big differentiator is that public agencies are concerned with the transportation metrics within their jurisdictions. Private sector companies are concerned with the same metrics nationwide.”
“EV is one of those technologies that – after being dormant at the sidelines for decades – has suddenly leaped ahead. They’ve benefited from government regulatory policies, reduction in cost, and a cultural shift toward sustainable living. It really has created a “perfect storm” that has resulted in a sharp uplift in demand for EV infrastructure.”
Where do you think the biggest bottlenecks still are, and how can they be overcome?
In terms of new mobility, the obvious bottlenecks lie with government regulations that are impeding the adoption of AVs. On the other hand, battery technology, although improving, remains a limiting factor for EVs. That said, I think EVs provide an example of what a big cultural transition can look like.
Gradually, then suddenly, as they say.
Speaking of those limiting factors, putting EV chargers where people need them is one challenge the industry faces right now. Who are the players who need better data to execute the electrification of America?
Other than the government agencies, we see four major players at different levels in the commercial sector that can benefit from rich mobility data:
Utilities: EV infrastructure planning
Chargepoint Operators: Charging sites selection
Charging hosts: The retailers, hotels, gas stations, etc who need to assess site performance
EV Fleet operators: The big trucking and supply chain cos that must select sites to make their operations as efficient as possible
Until we move to a fully autonomous future, mobility companies still rely on their employees to move parcels around on the road, transport bikes to optimal locations, install EV chargers, etc. What are some overlooked safety metrics they need to pay attention to as they prioritize worker safety?
This is an area where I think not enough attention has been paid — how crucial data can be to improving safety.
The confluence of high fidelity multimodal data and predictive analytics plays a pivotal role in worker safety. Advanced modeling techniques should be leveraged to help identify potential high-risk corridors and intersections where non-motorized traffic coexists with vehicles.
What is one “traditional” industry use case for transportation data that blows your mind?
Site selection is an age-old use case that spans multiple traditional industry verticals from retail to real estate, financial services, and Digital Out-of-Home (OOH) advertising. Now, multimodal mobility data adds a whole new dimension to that use case, as well as contextual richness that was not possible before. Now we can see so much more, beyond just who’s in the car. We can get the full picture of mobility.
For example, it is no longer sufficient to estimate only the number of visits to a location. We can now parse that information in vehicular and non-vehicular trips including the Metrics on where people are heading and how long they stay at their destination. Furthermore, we can measure the volume of trips at the store front or in a parking lot – or even within the viewshed of a billboard – rather than the general vicinity. This level of granularity is particularly useful in a dense urban environment and provides a much more sophisticated site analysis than anything we could accomplish in the past.
What are you most excited about when you think about the future of transportation?
Human imagination and ingenuity are truly remarkable. UAMs are the manifestation of flying cars of Jetsons. We’re electrifying transportation and working towards AV now, but who knows, teleportation of StarTrek may be forthcoming before too long.
Tax Equity In An EV Future: A StreetLight Study On The Miles Driven Tax
Tax Equity In An EV Future: A StreetLight Study On The Miles Driven Tax
America needs to find a sustainable way to fund its roads — and one that doesn’t overly burden drivers from disadvantaged communities.
Gas taxes are already inadequate to meet the cost of road construction, maintenance, and mass transit. Vehicle fuel efficiency and transportation project costs have risen considerably in the past few decades, while federal gas taxes have not budged since 1993. As a result, the Highway Trust Fund has experienced budget shortfalls every year since 2008.
And now, as EV infrastructure becomes more widespread, and EVs account for an increasing share of miles traveled, gas tax revenue will decrease further. While this shift will hopefully mean a welcome decrease in greenhouse gas emissions, the government will need to grapple with policy solutions to offset even lower gas tax revenues.
“The government should look for solutions that not only mitigate the gas tax shortfall but also create an equitable fee structure that doesn’t overburden drivers in disadvantaged communities.”
StreetLight looked at public data and our own metrics for VMT by county and income band in order to analyze a road usage tax in Colorado, which is considered one alternative to gas taxes, to see how it could impact people across two demographics groupings — income and geography.
The Bipartisan Infrastructure Law (also known as the Infrastructure Investment and Jobs Act) includes $75 million to support feasibility studies at the state, regional, and local levels for a road usage fee. As part of their research, agencies should investigate the potential equity impacts of a road user fee change. Equity is also a central piece of the BIL.
Under a “road user fee,” AKA a “vehicle miles traveled (VMT) tax,” drivers would pay a fee based either on regular odometer readings, or by opting to install a GPS-enabled device in their vehicle to track mileage. Some states, such as Oregon and Utah, have already launched opt-in programs to pilot this approach as an alternative to gas taxes. Many more will follow as BIL funds become available for feasibility studies.
State pilot programs typically set VMT tax rates at the level needed to accrue the same amount of revenue per year as the state gas tax. Therefore, vehicles with average fuel economy tend to pay about the same per mile under a VMT tax. Vehicles with low fuel economy pay less than they would otherwise pay under a gas tax, and those with high fuel economy pay more. The degree to which a household gains or loses is proportional to how many miles they drive per year. EV owners, who currently pay nothing in gas taxes, would see the biggest changes, with increases of about $150-200 per year, based on average miles driven. Even with this new fee, however, typical EV owners would still have much lower operating costs than owners of gas-powered vehicles.
As part of their evaluation, agencies should consider the potential equity impacts of this new funding strategy:
Who would pay more under a VMT tax?
Who would pay less?
How are different income groups and geographies affected?
Policymakers should investigate these dynamics to ensure that vulnerable groups would not be disproportionately impacted.
How a VMT tax would impact drivers, by income
We used data from the most recent National Household Travel Survey (NHTS) and StreetLight’s own Metrics in order to determine how a shift to VMT tax may affect drivers in Colorado. We analyzed these results by income level and geography in order to investigate whether any groups would be disproportionately affected.
First, we calculated the amount that drivers pay under the gas tax, versus how much they would pay under a VMT tax. For costs, we used the current state gas tax for Colorado ($0.22 per gallon) and the VMT rate used in Colorado’s Road User Charge pilot program ($0.012 per mile). To turn this into household-level expenditures, we used 2017 NHTS data about individuals’ vehicle type, fuel efficiency, annual mileage1, and income. Results are shown below:
StreetLight InSight® lets you visualize your results on the flyWithin each income category, the average household would pay $3-17 more under a VMT tax than they currently do under the state gas tax. This is a relatively small increase; the state gas tax amounts to $142 on average, with half of all households paying between $127 and $208.
Lower income households would see a smaller average increase under a VMT tax, with households earning less than $25k experiencing a $2.80 average annual increase.
We also analyzed the variation within each income bracket, to see how households across the dataset were affected. Below is a box plot showing the change in annual costs under a VMT tax. The bold line and label shows the average change for each income bracket. The blue box is the range that contains half of the sample households. The dashed lines are where the remainder of households fall, and the blue dots are outliers2.
1 We used the “BESTMILE” statistic in NHTS. This is the best-available estimate of each household’s mileage, based on odometer readings,
 self-reported VMT, and/or travel miles on a given day.
2 There are additional outliers which exist beyond the range of the y-axis on this graph. They are not shown due to space constraints.
This figure shows that, in the lowest income band, annual expenditures for most households do not vary by more than $10 in either direction. Higher income brackets show more variation, with households paying $10 less or up to $30 more.
To understand these results, we examined fuel economy, vehicle age, and annual mileage trends for each income band. We found that households in lower income brackets tend to own older vehicles whose fuel economy is somewhat lower (~2 mpg on average) than those in other income brackets. People in these households drive lower annual distances (about 1000-1500 miles) than those in higher income bands, lowering the impact of a VMT tax.
Those in lower income brackets also showed much less variation than those in high income brackets. This suggests that people in higher income brackets may have more choice about what type of vehicle they drive, including larger trucks as well as hybrids. Those in lower brackets may have less choice, but tend to own vehicles that are not as impacted by a switch to VMT fees; some pay a little less per mile, some pay a little more, and their lower annual mileage reduces the magnitude of the impacts.
Overall, we find that the increase under a VMT tax is quite low for all income groups, and those in the lower bands do not appear disproportionately impacted. Trends in EV adoption since 2017, which show faster adoption in higher income brackets, would likely increase the difference slightly for those groups. However, EV adoption is still so low that any changes would be very small.
How a VMT tax would impact drivers, by geography
We also examined potential changes based on geography. First, we looked at home locations based on NHTS community characterizations. We found that those in rural areas would pay a few dollars less on average under a VMT tax. Those in small towns ($18/year) and more urban areas would experience larger increases, potentially due to commuting patterns. This is a somewhat unexpected finding, as it seems intuitive that rural communities drive longer distances and thus would have a higher burden. It seems a VMT tax may be offset by the gains in no longer paying a gas tax to fuel a lower efficiency vehicle.
Finally, we mapped these changes to examine them visually across the state. This is where StreetLight’s data and Metrics come in. While the NHTS data provided a rich set of characteristics, the sample size isn’t large enough to extrapolate to local areas across the state. We took fuel economy distributions for each income band and applied it to Streetlight’s VMT by income band and county to estimate the overall impacts for each county in Colorado. Results are shown below.JTNDZGl2JTIwY2xhc3MlM0QlMjd0YWJsZWF1UGxhY2Vob2xkZXIlMjclMjBpZCUzRCUyN3ZpejE2NTIxMzMyMTUyNzMlMjclMjBzdHlsZSUzRCUyN3Bvc2l0aW9uJTNBJTIwcmVsYXRpdmUlMjclM0UlM0Nub3NjcmlwdCUzRSUzQ2ElMjBocmVmJTNEJTI3JTIzJTI3JTNFJTNDaW1nJTIwYWx0JTNEJTI3RGFzaGJvYXJkJTIwMSUyMCUyNyUyMHNyYyUzRCUyN2h0dHBzJTNBJTI2JTIzNDclM0IlMjYlMjM0NyUzQnB1YmxpYy50YWJsZWF1LmNvbSUyNiUyMzQ3JTNCc3RhdGljJTI2JTIzNDclM0JpbWFnZXMlMjYlMjM0NyUzQkRKJTI2JTIzNDclM0JESldaMzdGQ0slMjYlMjM0NyUzQjFfcnNzLnBuZyUyNyUyMHN0eWxlJTNEJTI3Ym9yZGVyJTNBJTIwbm9uZSUyNyUyMCUyRiUzRSUzQyUyRmElM0UlM0MlMkZub3NjcmlwdCUzRSUzQ29iamVjdCUyMGNsYXNzJTNEJTI3dGFibGVhdVZpeiUyNyUyMHN0eWxlJTNEJTI3ZGlzcGxheSUzQW5vbmUlM0IlMjclM0UlM0NwYXJhbSUyMG5hbWUlM0QlMjdob3N0X3VybCUyNyUyMHZhbHVlJTNEJTI3aHR0cHMlMjUzQSUyNTJGJTI1MkZwdWJsaWMudGFibGVhdS5jb20lMjUyRiUyNyUyMCUyRiUzRSUyMCUzQ3BhcmFtJTIwbmFtZSUzRCUyN2VtYmVkX2NvZGVfdmVyc2lvbiUyNyUyMHZhbHVlJTNEJTI3MyUyNyUyMCUyRiUzRSUyMCUzQ3BhcmFtJTIwbmFtZSUzRCUyN3BhdGglMjclMjB2YWx1ZSUzRCUyN3NoYXJlZCUyNiUyMzQ3JTNCREpXWjM3RkNLJTI3JTIwJTJGJTNFJTIwJTNDcGFyYW0lMjBuYW1lJTNEJTI3dG9vbGJhciUyNyUyMHZhbHVlJTNEJTI3eWVzJTI3JTIwJTJGJTNFJTNDcGFyYW0lMjBuYW1lJTNEJTI3c3RhdGljX2ltYWdlJTI3JTIwdmFsdWUlM0QlMjdodHRwcyUzQSUyNiUyMzQ3JTNCJTI2JTIzNDclM0JwdWJsaWMudGFibGVhdS5jb20lMjYlMjM0NyUzQnN0YXRpYyUyNiUyMzQ3JTNCaW1hZ2VzJTI2JTIzNDclM0JESiUyNiUyMzQ3JTNCREpXWjM3RkNLJTI2JTIzNDclM0IxLnBuZyUyNyUyMCUyRiUzRSUyMCUzQ3BhcmFtJTIwbmFtZSUzRCUyN2FuaW1hdGVfdHJhbnNpdGlvbiUyNyUyMHZhbHVlJTNEJTI3eWVzJTI3JTIwJTJGJTNFJTNDcGFyYW0lMjBuYW1lJTNEJTI3ZGlzcGxheV9zdGF0aWNfaW1hZ2UlMjclMjB2YWx1ZSUzRCUyN3llcyUyNyUyMCUyRiUzRSUzQ3BhcmFtJTIwbmFtZSUzRCUyN2Rpc3BsYXlfc3Bpbm5lciUyNyUyMHZhbHVlJTNEJTI3eWVzJTI3JTIwJTJGJTNFJTNDcGFyYW0lMjBuYW1lJTNEJTI3ZGlzcGxheV9vdmVybGF5JTI3JTIwdmFsdWUlM0QlMjd5ZXMlMjclMjAlMkYlM0UlM0NwYXJhbSUyMG5hbWUlM0QlMjdkaXNwbGF5X2NvdW50JTI3JTIwdmFsdWUlM0QlMjd5ZXMlMjclMjAlMkYlM0UlM0NwYXJhbSUyMG5hbWUlM0QlMjdsYW5ndWFnZSUyNyUyMHZhbHVlJTNEJTI3ZW4tVVMlMjclMjAlMkYlM0UlM0NwYXJhbSUyMG5hbWUlM0QlMjdmaWx0ZXIlMjclMjB2YWx1ZSUzRCUyN3B1Ymxpc2glM0R5ZXMlMjclMjAlMkYlM0UlM0MlMkZvYmplY3QlM0UlM0MlMkZkaXYlM0UlMjAlM0NzY3JpcHQlMjB0eXBlJTNEJTI3dGV4dCUyRmphdmFzY3JpcHQlMjclM0UlMjB2YXIlMjBkaXZFbGVtZW50JTIwJTNEJTIwZG9jdW1lbnQuZ2V0RWxlbWVudEJ5SWQlMjglMjd2aXoxNjUyMTMzMjE1MjczJTI3JTI5JTNCJTIwdmFyJTIwdml6RWxlbWVudCUyMCUzRCUyMGRpdkVsZW1lbnQuZ2V0RWxlbWVudHNCeVRhZ05hbWUlMjglMjdvYmplY3QlMjclMjklNUIwJTVEJTNCJTIwaWYlMjAlMjglMjBkaXZFbGVtZW50Lm9mZnNldFdpZHRoJTIwJTNFJTIwODAwJTIwJTI5JTIwJTdCJUUyJTgwJThCJTIwdml6RWxlbWVudC5zdHlsZS53aWR0aCUzRCUyNzEwMDBweCUyNyUzQnZpekVsZW1lbnQuc3R5bGUuaGVpZ2h0JTNEJTI3ODI3cHglMjclM0IlN0QlMjBlbHNlJTIwaWYlMjAlMjglMjBkaXZFbGVtZW50Lm9mZnNldFdpZHRoJTIwJTNFJTIwNTAwJTIwJTI5JTIwJTdCJUUyJTgwJThCJTIwdml6RWxlbWVudC5zdHlsZS53aWR0aCUzRCUyNzEwMDBweCUyNyUzQnZpekVsZW1lbnQuc3R5bGUuaGVpZ2h0JTNEJTI3ODI3cHglMjclM0IlN0QlMjBlbHNlJTIwJTdCJUUyJTgwJThCJTIwdml6RWxlbWVudC5zdHlsZS53aWR0aCUzRCUyNzEwMCUyNSUyNyUzQnZpekVsZW1lbnQuc3R5bGUuaGVpZ2h0JTNEJTI3NzI3cHglMjclM0IlN0QlMjB2YXIlMjBzY3JpcHRFbGVtZW50JTIwJTNEJTIwZG9jdW1lbnQuY3JlYXRlRWxlbWVudCUyOCUyN3NjcmlwdCUyNyUyOSUzQiUyMHNjcmlwdEVsZW1lbnQuc3JjJTIwJTNEJTIwJTI3aHR0cHMlM0ElMkYlMkZwdWJsaWMudGFibGVhdS5jb20lMkZqYXZhc2NyaXB0cyUyRmFwaSUyRnZpel92MS5qcyUyNyUzQiUyMHZpekVsZW1lbnQucGFyZW50Tm9kZS5pbnNlcnRCZWZvcmUlMjhzY3JpcHRFbGVtZW50JTJDJTIwdml6RWxlbWVudCUyOSUzQiUyMCUzQyUyRnNjcmlwdCUzRQ==
Again, we see slight increases in annual taxes across all areas, ranging from $1 to $11. The most urban (Denver) and most rural counties are some of the least affected, with average drivers paying only $1-4 more under a VMT tax. The more affected areas are between Denver and Colorado Springs, in counties with relatively high average annual mileage. These may be areas with higher numbers of long-distance commuters who own relatively fuel-efficient vehicles.
Grant applicants have used StreetLight for everything from highlighting commuting metrics to show a project’s economic value to using bike and pedestrian metrics to give the full mobility picture to origin-destination analysis to show regional benefit.
In Ohio, for example, the state DOT embarked on a project to revamp Interstates 70 and 71, which would improve corridors of the National Primary Highway Freight System and help reconnect communities adversely affected by redlining and the construction of those interstates.
To fund Phase 4 of the development, Ohio DOT applied for a federal Infrastructure for Rebuilding America (INFRA) grant and used StreetLight to make their case.
Using the platform, planners separated out passenger vehicles from commercial truck volume, proving the significant percentage of traffic on the corridor from freight movement. They used StreetLight’s visualization tools to show truck congestion in the existing corridor and make the case for how a new truck route would ease the national supply chain.
Findings
Overall, we found that a VMT tax in Colorado would cause a slight increase in annual expenditures for all income brackets, but that those in the lowest income bracket saw a smaller increase with less variation across households. Those in higher income brackets tend to own a wider range of vehicle types that are more efficient on average, and they drove longer distances. This leads to a higher average increase per year, with some households more affected than others due to vehicle choice and driving patterns.
Geographically, we found that those in rural areas would save a few dollars per year, and that those in more urban areas would pay about $15-18 more. When we extrapolated out findings to all counties in the state, we did not see strong trends or differences across counties. Again, every area saw a slight increase, with the biggest increase ($11) occurring in counties likely to contain long-distance commuters.
Our findings suggest that very low-income populations and rural counties would not be disproportionately impacted by a shift from gas taxes to mileage-based user fees.
The Deadline to Submit EV Plans (and Get NEVI Funding for Your State) Is Almost Here. Got the Mobility Data You Need?
The Deadline to Submit EV Plans (and Get NEVI Funding for Your State) Is Almost Here. Got the Mobility Data You Need?
Huge changes are about to occur in our electric vehicle infrastructure. More than 7.5 billion federal dollars are heading to the states, beginning with funds to expand our nationwide network of EV chargers ten-fold. With important funding deadlines coming up soon, states need to move fast. First order of business? State DOTs must closely examine the mobility landscape to identify and build a map of optimal EV charging locations in their regions.
Get Your AFC Nomination Reports and NEVI Deployment Plans Finished On Time
States will be apportioned infrastructure dollars through the newly-formed National Electric Vehicle Infrastructure (NEVI) Formula. To be considered for funds, states must designate Alternative Fuel Corridors (AFCs), highway segments with the current or planned infrastructure to support fully electric private and commercial vehicles. The NEVI formula also requires that AFCs take rural areas, air quality improvement, and access for disadvantaged communities into consideration.
Two important dates should be on your calendar.
May 13: Deadline for designating Alternative Fuel Corridors (AFCs)
August 1: Submission deadline for EV Infrastructure Deployment Plans to the Joint Office of Energy and Transportation
Mobility Analytics Help Answer Four Key Questions For Optimal EV Charging Site Evaluation
Even if your state has a solid EV charging network today, you’ll need to investigate whether your existing corridors are sufficient—and if they aren’t, identify where infrastructure gaps lie. Start with these four questions:
1) What is the existing traffic demand? Your first step is to identify the current traffic demand at various locations. You can use Metrics from the StreetLight platform to understand vehicle volumes (for all vehicles, not just EVs) at these locations and pinpoint trip activity hotspots. You can also evaluate highway exits in your state to determine which exits have the highest traffic demand. These insights will help you decide which exits will provide accessible and reliable charging locations for long-distance trips. Existing traffic demand data will greatly help you evaluate AFCs for your NEVI funding proposal.
2) What are the aggregate demographic characteristics of existing drivers at these sites? StreetLight InSight® combines traffic volume data with demographics such as education level and household income, analyzing where aggregate groups of people live, work, and shop. Beyond spotting activity hotspots, the data reveals the purpose behind drivers’ travel. This includes whether people are coming, say, from home to the shopping plaza or stopping there on the way home from work. These Metrics help determine the traveler profile at these potential or existing EV sites. This greatly aids in EV charger planning, because it shows the precise hotspots—like a mall or a theater, or an office park—where people purposely schedule activities to access public charging stations.
3) Where are vehicles coming from and going? Origin-Destination Metrics and Top Routes are important pieces of the infrastructure puzzle. StreetLight InSight® will show you how far travelers have come to reach a popular destination, as well as the most frequently used roads and highway corridors. These insights will help planners determine where to build key nodes of a larger charging network or corridor. They also determine the types of chargers that might best serve travelers.
These Metrics are a great place to start when trying to determine where the traffic demand is along AFCs within a region.
4) How long are vehicles staying at certain sites? To build a viable charging infrastructure, you must understand dwell times at destinations like shopping plazas, office buildings, movie theaters, and more. Once you know how far people travel to get to primary destinations, you’ll need to see how long they stick around. This information will help you predict charger use and the type of chargers that will best support travelers. For example, 30-minute DC fast chargers are needed outside of a grocery store or a movie theater. They’re pricey but absolutely necessary. On the other hand, Level 2 chargers—which are slower but less costly—would work well at longer dwell destinations like a hotels.
Two Interstate Exits Have Very Different Charger Needs
At two different Massachusetts Turnpike exits, the dwell time (the length of stay at a given location) varies tremendously. Exit 9, filled with shops, grocery stores, and restaurants, shows that vehicles are mostly parked for 20-60 minutes—enough time to grab a burger. Exit 12, with its hotels, offices, and entertainment park, generally keeps people lingering for more than four hours. Big difference.
Comparing dwell time of different exits on a highway corridor
These dwell time findings offer a great view into the type of chargers that would make sense for each exit. Investment in DC fast charging would be more appropriate for Exit 9, whereas Exit 12—which draws the longer stays—would be very well served by less expensive Level 2 or 3 chargers.
Looking to Attain Specific Policy Goals (Like Equity)?
StreetLight Data offers a regional scanning tool to identify specific charging gaps and provide insights into aspects such as utilization potential, trucking, and identifying prime locations. If you’ve already located key sites, but need data to support equity initiatives—like Justice40—layer on metrics to optimize for equity scenarios involving disadvantaged and low-income communities, as well as exposure to air pollution. Equity is a huge part of the future of EV infrastructure, so the sooner you gather the equity picture for your state, the better.
Drive Your Bid for Infrastructure Dollars
There are a limited number of dollars, and the stakes are high. Mobility metrics and demographic data can support your proposal for NEVI Program funds. StreetLight’s EV offerings will help you identify optimal charging sites along key corridors to serve your key priorities, grow EV adoption, and help shape our EV future as a nation.
As U.S. pushes a shift toward electric cars, where should the chargers go?
As U.S. pushes a shift toward electric cars, where should the chargers go?
Summary of story written by Michael Laris, The Washington Post originally published December 29, 2021
This article dissects the issues impacting federal guidelines for investment in charging stations, including where electric vehicle chargers should be placed to meet the needs of all communities, not just affluent drivers traveling on the busiest roadways.
StreetLight’s EVinfrastructure planning metrics address those issues, spanning the identification of gaps in the current EV charging station network, predictive tools around future EV demand, demographic overlays, and project-level tools to help streamline traffic study work required to deploy chargers right now.
The article quotes Transportation Secretary Pete Buttigieg, Energy Secretary Jennifer Granholm, as well as StreetLight CEO Laura Schewel, who had worked at the Federal Energy Regulatory Commission on electric vehicle policy prior to founding StreetLight.
Laura Schewel commented on the need to consider EV charging locations outside of the most obvious high-traffic roads and highways, pointing out that…
“the most convenient way for many people to charge is at home overnight, or at work… with lower-income residents having limited control over their [ability to charge overnight] because they’re renters or they street park.”
To learn more about the issues examined by The Washington Post, read the full story.
Huerta joins the StreetLight Data Board of Directors as the company looks to harness its rapid growth to further help state, local and national entities improve their data driven understanding of how the country moves, and thus how to best invest infrastructure dollars.
“From helping manage and prepare for the Olympic Winter Games, to the years working with the FAA, I considered my work with the U.S. Department of Transportation an incredible opportunity to help shape the country’s future,” said Michael Huerta.
“StreetLight Data offers technology and insight into infrastructure needs that the country had never considered possible before.”
“What impressed us about StreetLight was its ability to innovate and build meaningful insights from a rapidly expanding base of data. We expect that those insights will have broad application and deliver significant value across multiple industries,”
About StreetLight Data
StreetLight pioneered the use of Big Data analytics to help transportation professionals solve their biggest problems. Applying proprietary machine-learning algorithms to over four trillion spatial data points over time, StreetLight measures diverse travel patterns and makes them available on-demand via the world’s first SaaS platform for mobility, StreetLight InSight®. From identifying sources of congestion to optimizing new infrastructure to planning for autonomous vehicles, StreetLight powers more than 6,000 global projects every month. For more information, please visit:www.streetlightdata.com.
Please provide your contact information so we can send the latest insights and research from StreetLight to your inbox; you can unsubscribe at any time.